Understanding Project Intelligence
Watch the short video to learn what Project Intelligence is and how it can help your business.

With Baker Tilly’s Project Intelligence, increase real-time visibility to gain an in-depth understanding of employee efficiency and uncover project trends that drive intelligent business decisions.
Watch the short video to learn what Project Intelligence is and how it can help your business.
If you're currently using Sage Intacct to monitor employee time and bill your clients, then Project Intelligence is tailored for you.
Many companies extract timesheet data to Excel to calculate employee key performance indicators (KPIs) and manage projects in third-party systems. These practices often lack the timeliness and accuracy to quickly review project health.
With Project Intelligence, eliminate manual processes to increase profitability and offer your employees quantifiable metrics to evaluate their performance.
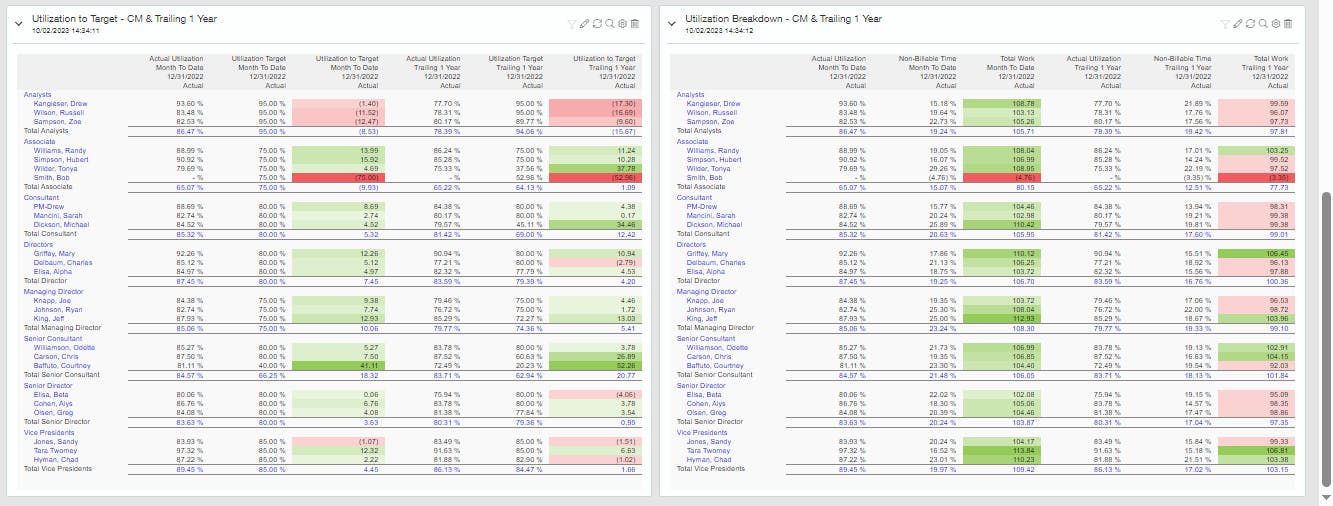
Obtain detailed metrics for individual employees and groups. Determine who is achieving their billable targets, identify those needing more work and support those who might be overallocated.
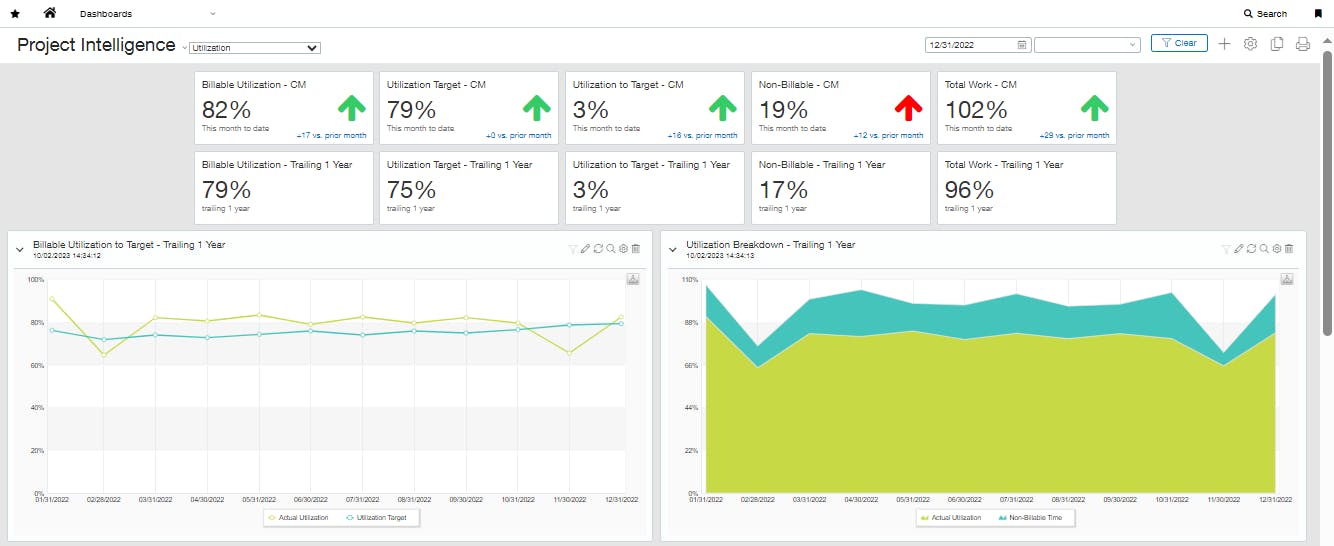
The utilization dashboard can help with the following:
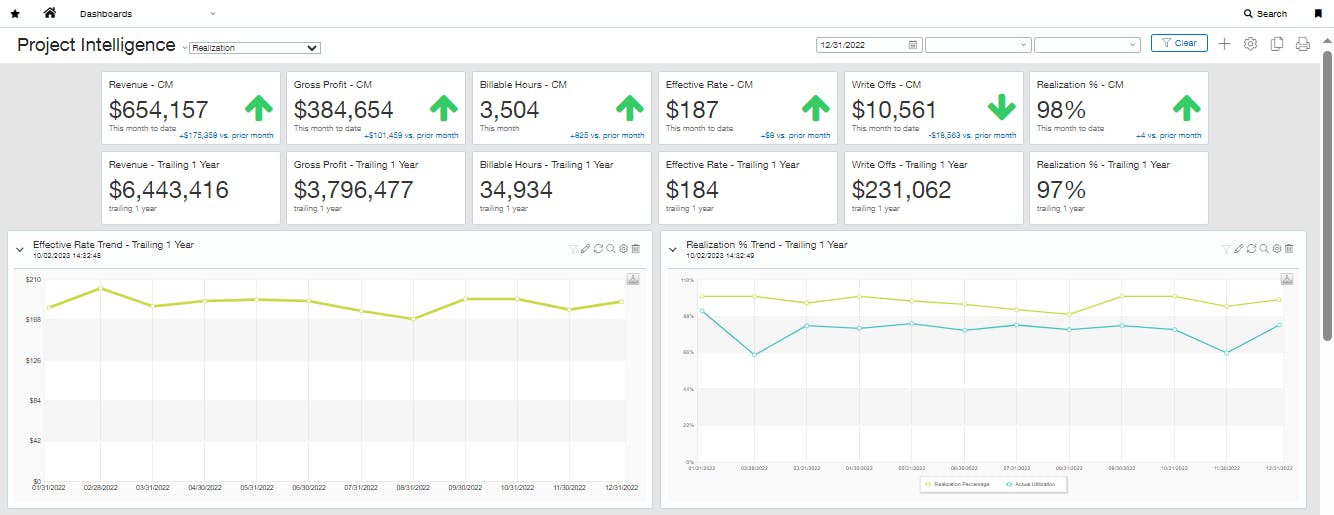
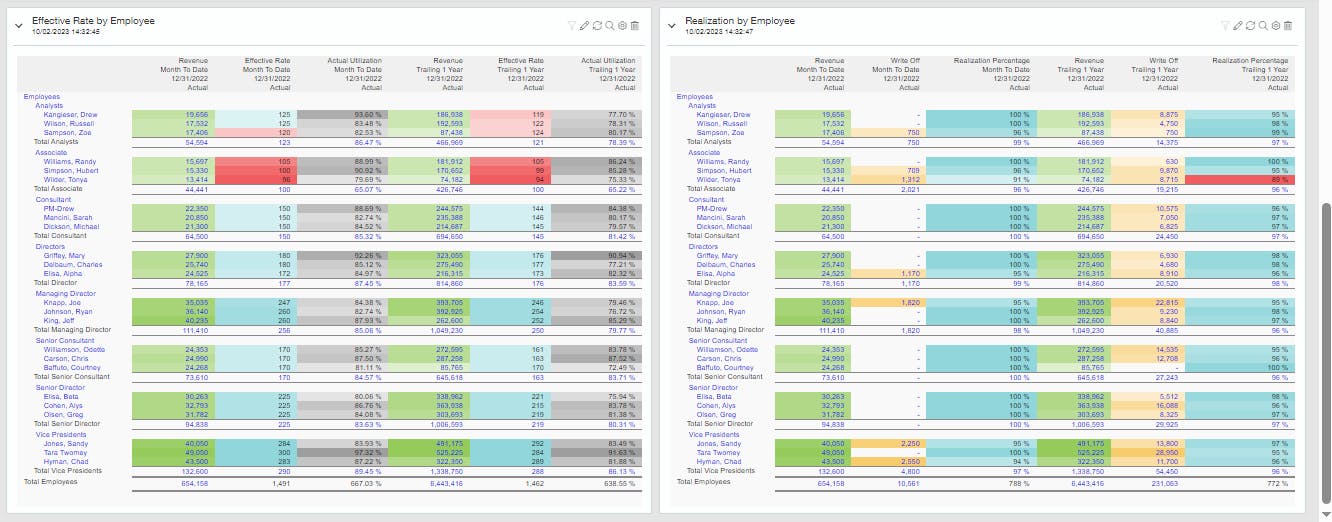
Explore the revenue contribution, effective rate and write-offs of your team members, allowing you to quantify employee performance with more than billable hours. Understand which employees have consistent problems with write-offs, and the effective rate you’re achieving across employees and positions.
The realization dashboard can help with the following:
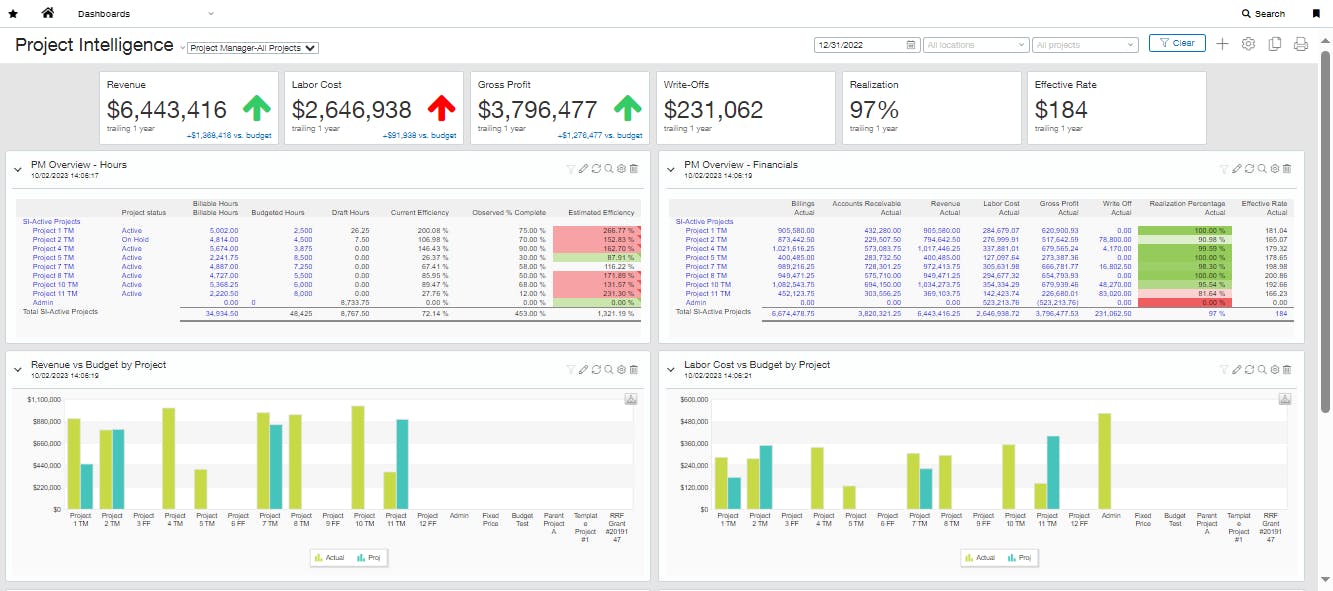
Gauge the health of your projects. Provide crucial project metrics for service leaders and project managers, including project hours against the budget, projected efficiency and core financial metrics such as accounts receivable, revenue and profit. Identify early on when a project is off track or at risk, allowing you to take corrective actions to meet business objectives and improve financial performance.
The project manager dashboard can help with the following:
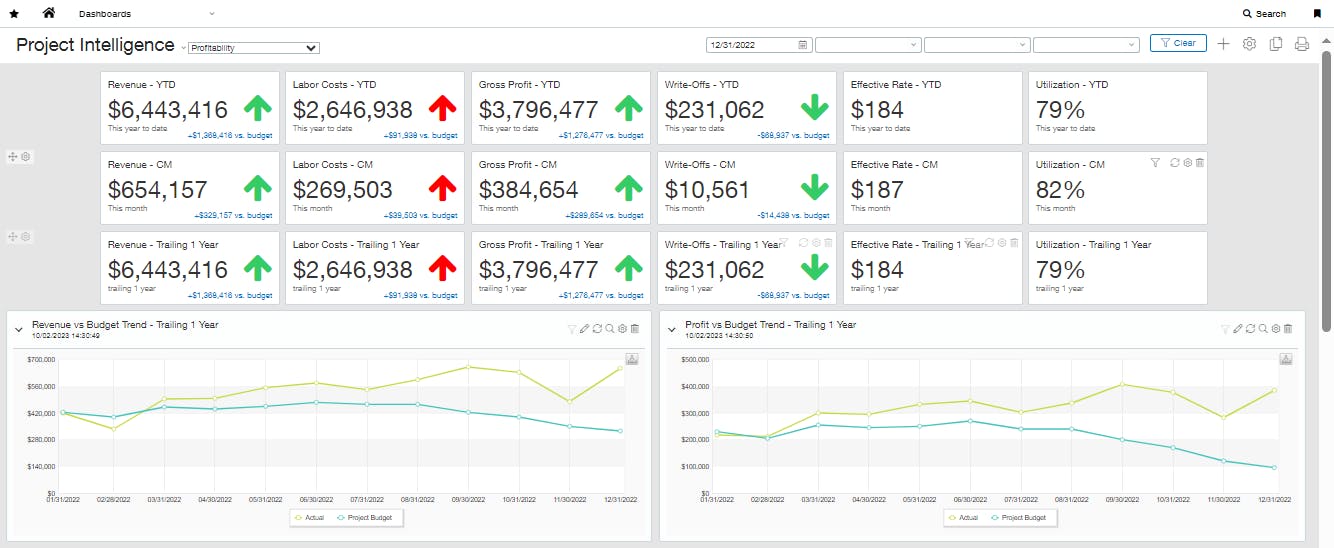
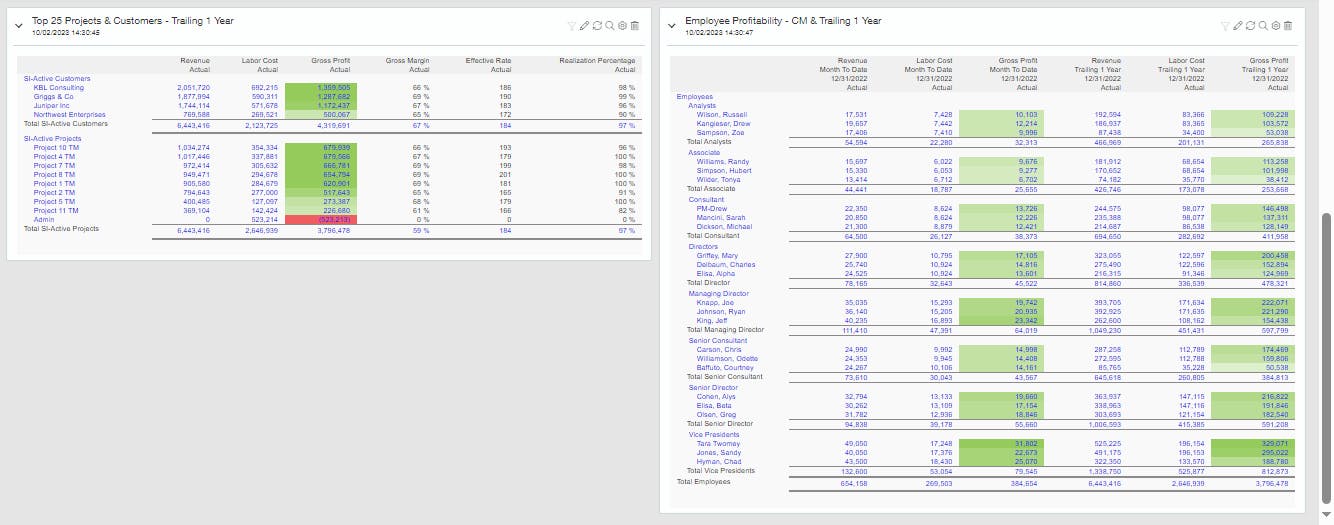
Evaluate the profitability of your service team through a detailed analysis of the projects, clients and employees driving revenue. Review your project financials compared to your financial budget, trending over the last 12 months. Identify growth opportunities and areas for improvement among your client base, service lines and employees.
The profitability dashboard can help with the following:
With Project Intelligence, both service leaders and employees can:

Northeast Technical Services struggled with a lack of accurate and customizable metrics for managing employee utilization and project profitability. More specifically, their metrics were being tracked and calculated in Excel because it wasn’t possible to calculate and report on them directly out of Sage Intacct.
Learn how Baker Tilly helped the business implement Project Intelligence to optimize the analysis of project and employee performance while saving their team time each month.
With Project Intelligence, you have access to a vast array of new performance metrics to effectively evaluate customer and project performance. These metrics are available out of the box, with a set of dashboards and reports that provide the insight you need to run your business.
Measures the ratio of billable hours worked by employees to the total available work hours.
The utilization percentage an employee spends on activities that don't contribute directly to revenue.
Target percentage of working hours to spend on billable projects and tasks.
Compares an employee's actual billable utilization with the target to determine if they've met their utilization goal.
The overall percentage of time an employee is utilized for work-related activities, including both billable and nonbillable tasks.
The total amount of service revenue.
The total cost of service labor.
The difference between service revenue and the costs associated with producing or delivering services.
The amount of time an employee spends working on tasks or projects that can be directly tied to revenue.
The average hourly billing rate for services.
The dollar amount of service revenue unable to be billed or collected.
The percentage of billable hours that translates into service revenue.
The amount of time an employee is budgeted to work on tasks or projects directly tied to revenue.
The number of hours on timesheets that haven't been submitted/approved.
The ratio of billable hours to budgeted hours.
The estimate of how complete the project is as of a specific date listed on the project.
The estimated final actual to budgeted hours on the project based on the current hours used and observed % complete.
The total amount invoiced to clients.
The outstanding amount owed by clients.
