How data analytics can help banks make smart strategic decisions
Banks and other financial institutions capture a variety of data about their customers, loans and deposits. A Baker Tilly webinar highlighted ways that banks can harness that data in visually effective ways to support strategic decision-making. Doing this successfully requires banks to have a commitment from leadership to provide the funding and human resources to do a better job of collecting and managing the right data.
Data analytics basics
Bad data or poor data quality costs U.S. businesses about $3 trillion annually, and breeds bad decisions made from having data that is just incorrect, unclean, and ungoverned.
Some of the most successful companies in any sector are data driven; they use sophisticated data analytics not just to learn how the company performed in the past or is performing in the present, but harness that data to answer questions like, “What will happen next? How can we make it happen?”
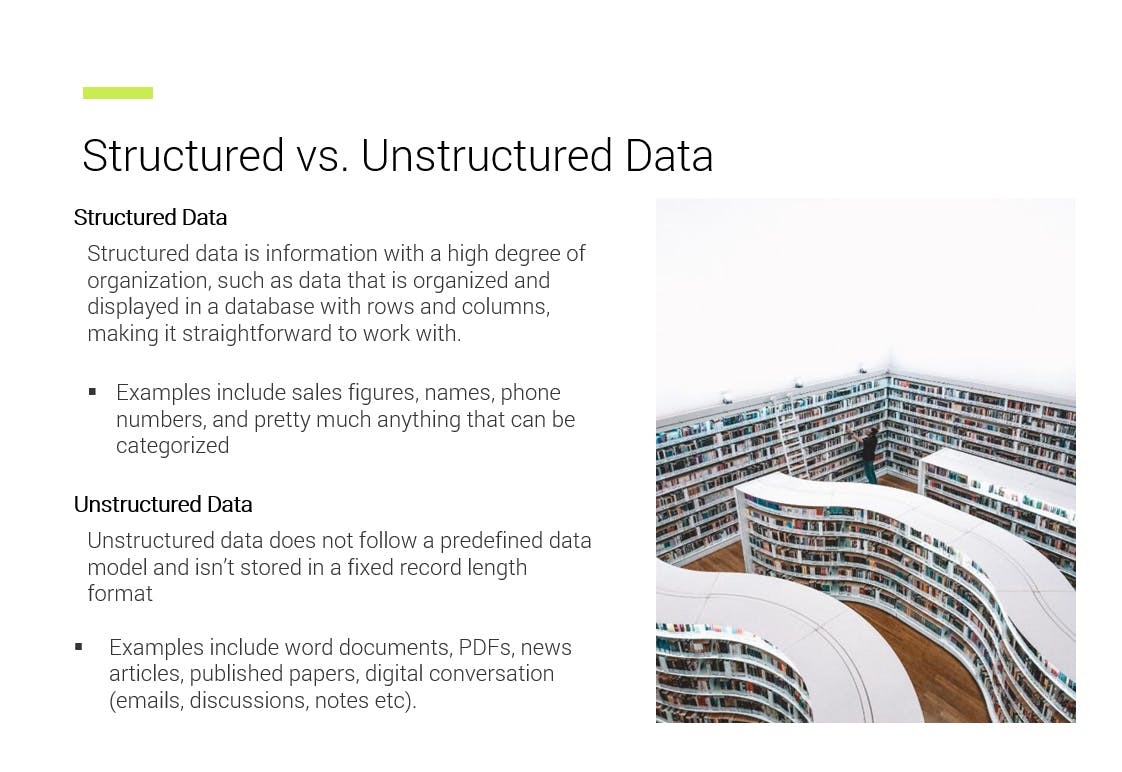
Companies generally have two types of data: structured and unstructured. Structured data is information that can be organized in tables or a database: customer names, age demographics, loan balances, interest rates for different types of accounts. A business can establish relations among different types of data within a database.
Unstructured data is key information that exists in written reports, online customer reviews, or handwritten notes from sales people. It is information that does not fit into a standard database and is not easily relatable to other data – structured or unstructured. Examples of unstructured data include YouTube videos; Twitter tweets; and Facebook posts.

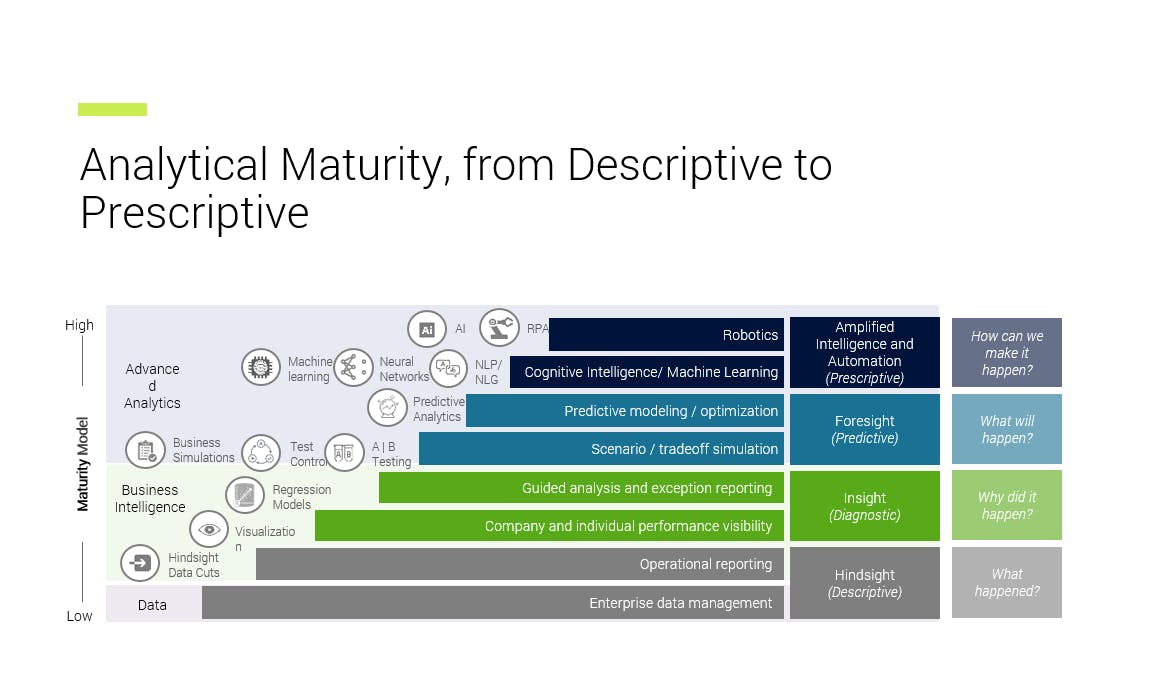
If data analytics is the engine, then data is the gasoline that powers it. A maturity model for data analytics shows a progression from descriptive to prescriptive uses for data. What the model shows is that everything starts with data management: getting and cleaning data, and putting it into a format where it can be used, governed, controlled and treated as an asset.
The descriptive level of data analytics answers questions like, “What happened?” The diagnostic level answers, "Why did it happen?" The predictive level looks at “What will happen?” For example, "If I send certain types of emails to a prospect, what is the likelihood of them opening them?" Finally, at the prescriptive level, a company applies artificial intelligence, machine learning or robotics on large sets of structured and unstructured data to answer, “How can I make it happen?”
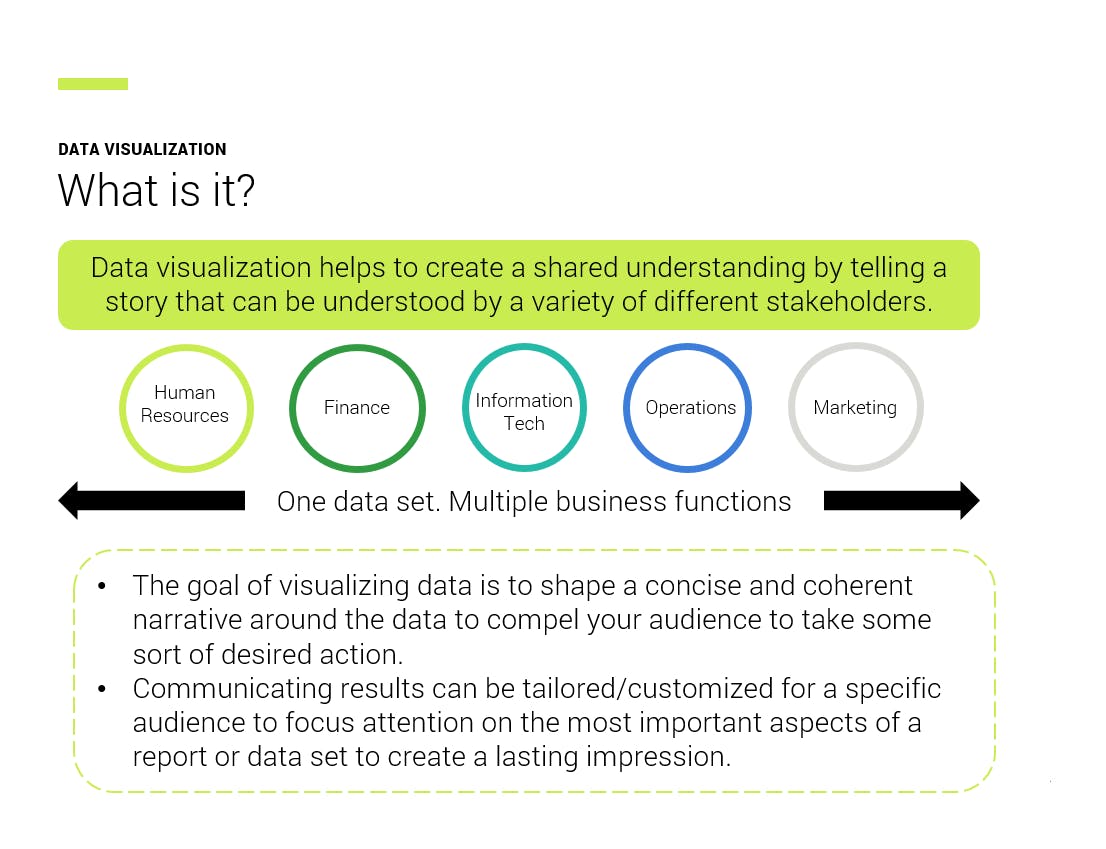
Companies who are concerned about the complexities and cost of robust data analytics should know that existing cloud-based computing technology is inexpensive. Companies can import basic data and overlay a Tableau or similar dashboard that creates a compelling visual representation of data easily understood by different management teams.


Visual insights support key banking needs
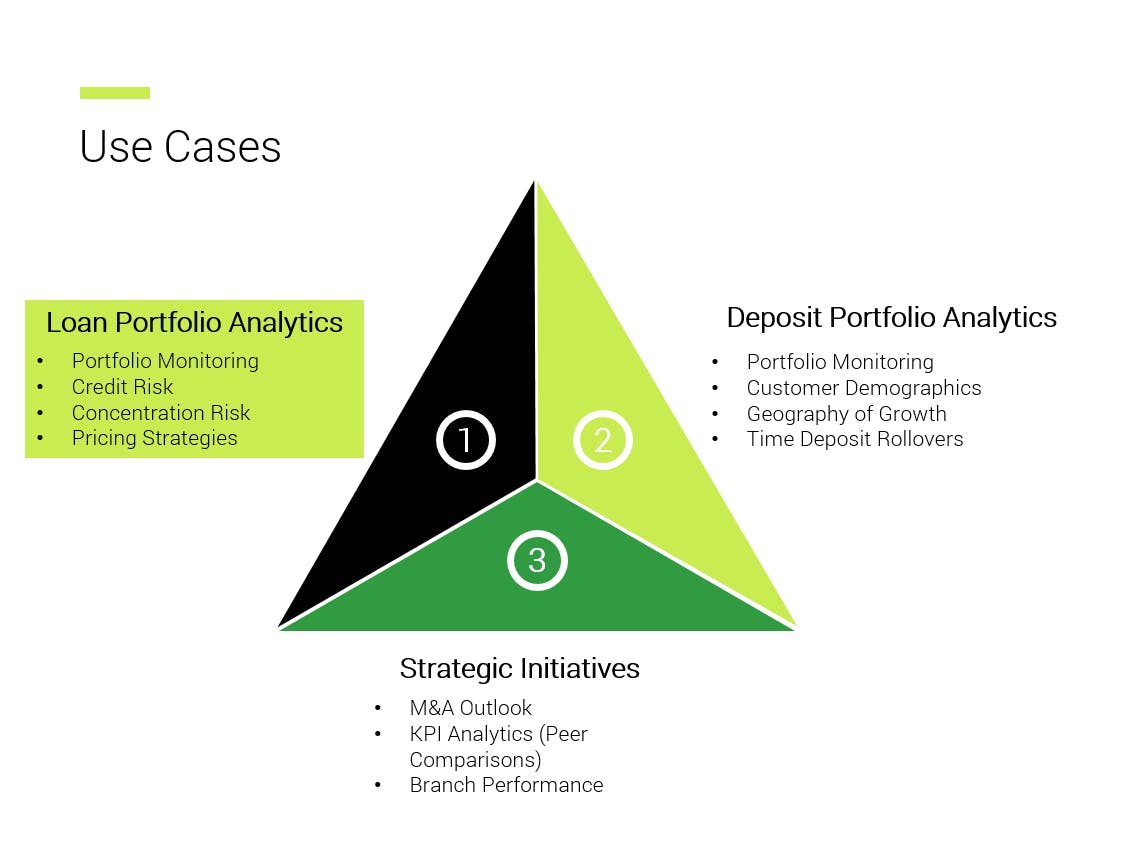
Sean Statz, senior manager, financial services, noted that by using data visualization tools like Tableau, banks can create practical visual insights into their loan and deposit portfolios, which in turn will support specific strategic initiatives.
Loan portfolio analytics

Starting with a simple extraction of a bank’s loan data at a point in time, a bank can generate a variety of visual displays that help it understand the credit and concentration risks of its loan portfolio. Repetitive reporting allows the bank to analyze trends easily among different time periods. For example, the bank can quickly access credit risk metrics such as loans at lower grade risk ratings or those that are delinquent, as part of a strategy to mitigate credit loss in general.
Once the bank understands the distribution of credit risk in its portfolio, it can investigate new pricing strategies. Tableau can generate a view that includes a heat map of loans by balance, so the bank can quickly observe the interest rates on different loans at any point in time. Another view will display loss rates by risk rating which can help a bank determine the real return or actual yield it is earning on its loans.
Deposit portfolio analytics
Statz said that sophisticated analytics of deposit characteristics will help banks better understand customer demographics, and then adjust their strategies to both grow deposits and retain different types of customers. Again, banks can take one set of data and create several visuals that highlight different characteristics of that data. For example, starting with a simple display of demand deposits, savings accounts and certificates of deposits, a bank can generate geographic representations of customers by age, account averages, and maturity schedules.
All this information will help guide bank decisions about where to open or close branches, or prepare for when certificates of deposit mature. Banks can anticipate questions like, "When CDs roll over, what products will we offer? If we retain all or only half of CD customers, but at higher interest rates, how does that affect cost of funds and budget planning?"
Strategic initiatives
Finally, banks can use data analytics – their own coupled with publicly available data about their competition and their geographies – to develop new strategies ranging from changes in their loan portfolios, building new branches or looking for merger or acquisition partners.
Data analytics can help banks undergo more sophisticated key performance indicator (KPI) comparisons with their peers, not just at an aggregate national or statewide banks level, but even a more narrow comparison into a specific asset size. Using call report information, banks can do a point-in-time KPI comparison but also look at year-over-year trends with peer banks.
Getting started
Banks face key challenges in effective data analytics:
- Tracking the right data
- Storing and extracting it
- Validating it
- Resourcing correctly
The biggest challenge banks need to tackle is determining if they have been tracking the necessary data to tackle a specific problem. For example, the Financial Accounting Standards Board’s new current expected credit loss (CECL) standards require banks and other financial institutions to report their credit losses using a new methodology. If banks are not already tracking credit quality characteristics they will need for the CECL standards, they need to start capturing that data now.
Banks often have data stored on different systems – residential real estate loans on one system, commercial loans on a different system. This makes extracting the data in a way that supports data visualization like Tableau difficult.
Banks have to validate the data for accuracy, and identify any gaps in either data collection or inputting through the system.
Banks have ensure they have the human resources and tools to extract, scrub and manipulate essential data to build out a meaningful analytic based on each data type.
The key for data analytics to be successful, however, is a leadership team committed to developing this data maturity mindset, whether internally or with help from a third party.
For more information on this topic or to learn how Baker Tilly specialists can help, contact our team.
