Professional walking through office using digital tablet
Resource

Governance dashboard for market intelligence

Chart your course with timely data insights and market intelligence

Our proprietary governance dashboard offers a unique, consolidated view of market drivers and forces that influence governance. We collect and analyze a myriad of market and research sources to provide boards and audit committees with a concise picture of what’s happening and what could be ahead. Baker Tilly's governance dashboard is updated monthly and includes current status of the following key measures:

Inflation

Inflation gauge

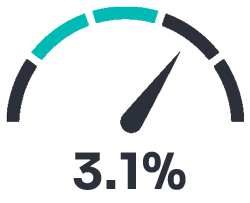
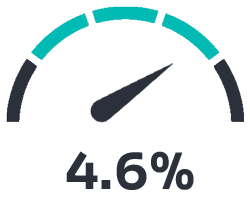
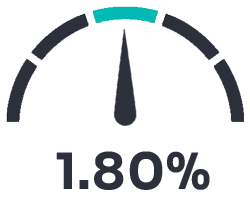
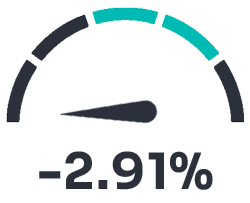
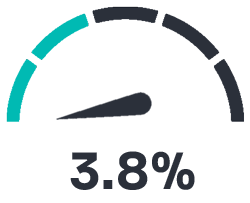
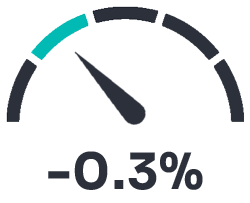
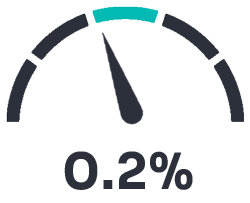
Inflation is the rate at which the value of a currency is falling and, consequently, the general level of prices for goods and services is rising.

Rising rates indicate inflation while declining rates indicate deflation. Economists state that there is an acceptable long-term inflation rate of 2% which delivers manageable market growth without straining budgets.

Back to top

CBOE Volatility Index

CBOE Volatility Index

The CBOE Volatility Index represents the market's expectations for the relative strength of near-term prices changes of the S&P 500 Index.

Low values, generally less than 20, will indicate market strength and confidence in the market’s direction in the short term. Conversely, higher values reflect uncertainty or stress expected in the market. The VIX typically runs opposite of trading markets. For example, an equity market selloff would accompany a rising VIX score as investor fear rises.

Back to top

Consumer Sentiment

Consumer Sentiment

The Consumer Sentiment Index is a monthly survey of how consumers feel about the economy, personal finances, business conditions, and buying conditions.

Higher index values reflect greater or increasing consumer confidence while lower values typically indicate perception that consumers are wary over the short-term economic outlook as well as their own, personal, prospects.

Back to top

US Treasury Yield

US Treasury Yield

The 10-year yield is used as a proxy for mortgage rates and is seen as a sign of investor sentiment about the economy.

Generally, a rising yield signifies the expectation for more economic growth while declining yields suggest an expectation for economic slowdown. Further, rising yields indicate lower demand for Treasury bonds and investor demand for higher-reward (and risk) investments.

Back to top

Economic Expansion (GDP)

Economic Expansion (GDP)

Economic Expansion measures the change, quarter-over-quarter, in the real Gross Domestic Product; evaluating the country's economic health.

Positive rates signify overall economic growth while negative rates signal that the economy is contracting. For sustainable long-term growth, economists believe that the ideal GDP growth rate is between 2-3%.

Back to top

Change in Dow Jones

Change in Dow Jones

The Dow Jones Industrial Average is a stock market index that tracks 30 large, publicly-owned blue-chip companies trading on the NYSE and Nasdaq. This measure represents the change, month-over-month, in the index value.

Through this indicator we are tracking monthly change in adjusted close value of the market, adjusted close as represented on the first trading day of the new month. Negative values indicate that the index value has decreased, month-over-month.

Back to top

Unemployment Rate

Unemployment Rate

The unemployment rate reflects the health of business in the economy. It measures the percentage of the labor force without a job.

The unemployment rate can be interpreted as the share of the total labor market above the age of 15 without employment (unemployed/employed and unemployed) x 100. It does not account for those who have given up actively searching for employment or if workers are underemployed.

Back to top

Change in C&I Loans

Change in C&I Loans

Commerce and Industry (C&I) loans provide companies with funds that can be used for working capital or to finance capital expenditures.

C&I loan activity can be a leading indicator of Gross Domestic Product. As more loans are procured in the C&I sectors, it can be indicative of increased manufacturing or supply capabilities to meet demand. Positive index values signify an increase, month-over-month, in loans extended to C&I customers.

Back to top

Manufacturers' New Orders

Manufacturers' New Orders

Durable goods orders tell investors what to expect from the manufacturing sector and provide insight into supply chain. This measure represents the monthly change in value.

Each month the Census Bureau reports on the value of new domestic orders for manufacturers. We are translating this into a percentage change versus prior month to simply state growth or decline in order activity. Positive values represent a growth in orders while negative values indicate a decline.

Back to top

Team of professionals working on computer
Next up

Chief Information Officer-Solutions and Partners 4 (CIO-SP4)