Chicago Skyline

M&A activity in Great Lakes region slows in H1 2022

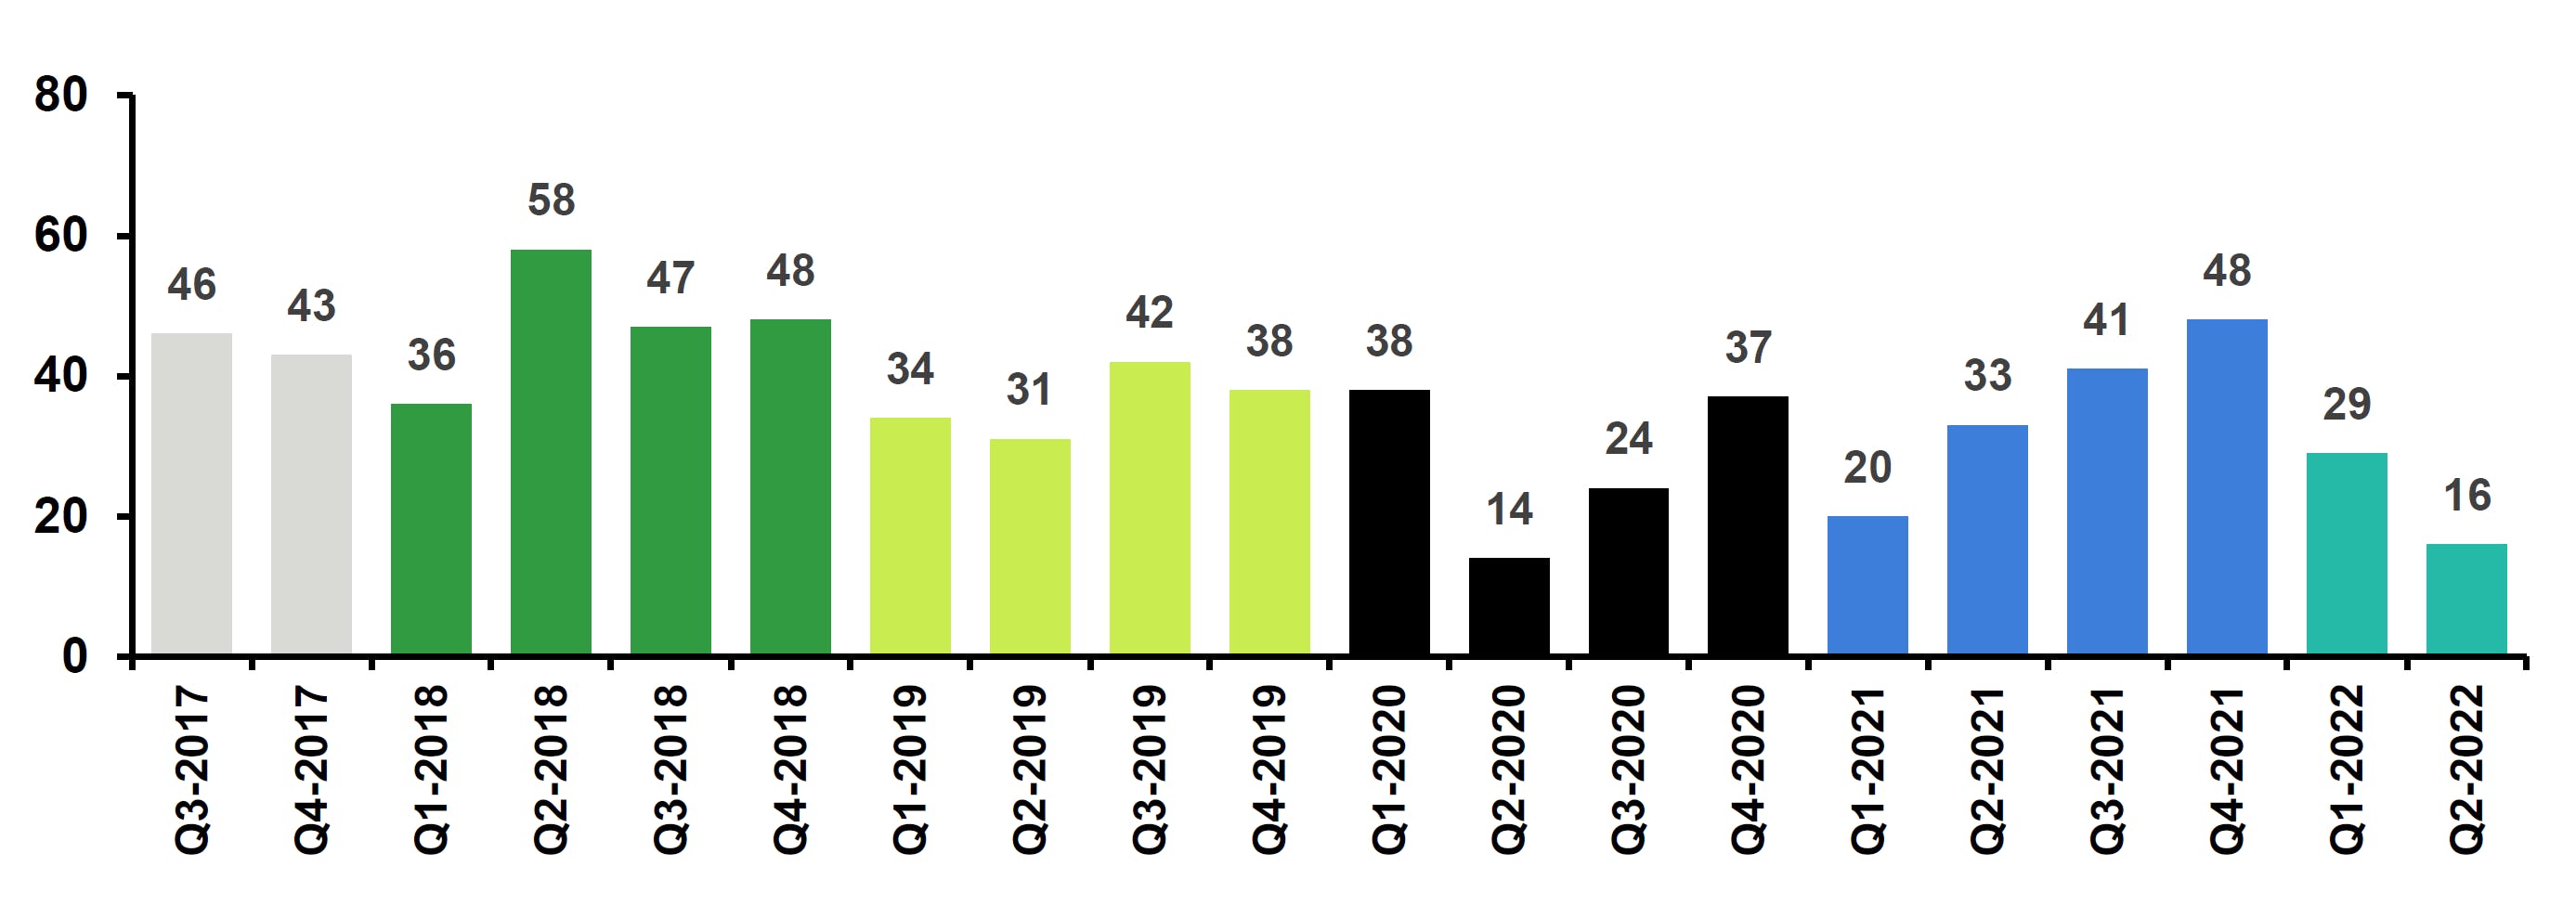
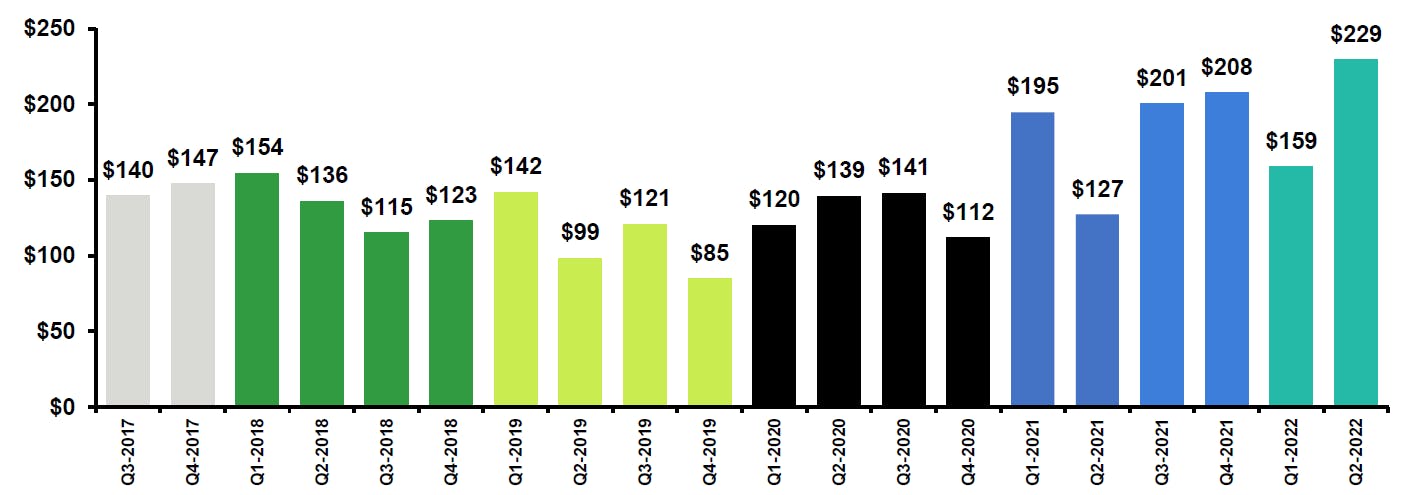
Middle market M&A activity in the Great Lakes region declined in H1 2022. This decline is on par with H1 deal flow in both 2021 and 2020. However, Q2 saw a significant increase in deal value over Q1.

Although middle market M&A activity in the Great Lakes region during H1 2022 was considerably lower than in H2 2021, the average value of deals increased significantly.

  • A total of 45 transactions were announced in H1 2022, down from 89 in H2 2021
  • The aggregate disclosed value of M&A transactions in H1 2022 totaled $8.3 billion, up slightly from $8.1 billion in H1 2021, but lower than the aggregate $18.2 billion in H2 2021
  • The average value of reported deals increased to a new recent high of $229 million in Q2 2022 from $159 million in Q1 2022.

Great Lakes middle market M&A transactions / Number of closed transactions (1)

Great Lakes middle market M&A transaction H1 2022

Source: S&P Capital IQ.
(1) Includes only transactions with disclosed enterprise value between $10 million and $1 billion.

Great Lakes middle market M&A transactions / Average closed transaction value (1)

Great Lakes middle market M&A transactions h1 2022 Average closed transaction value

Source: S&P Capital IQ.
(1) Includes only transactions with disclosed enterprise value between $10 million and $1 billion.

Illinois continues to lead region in M&A activity

Illinois again had the most transaction activity in H1 2022, with a total of 15 transactions. This follows a similar trend from H2 2021. Ohio and Minnesota followed with nine and seven, respectively. Indiana had six deals closed in H1 2022.

Based on number of closed transactions, strategic buyers continued to be the most active buyer type in the first and second quarters of 2022 in the Great Lakes region.

The information technology and consumer discretionary segments were the most active during the first half of 2022, accounting for 20% and 18% of M&A deals announced, respectively. The energy, healthcare, financial and industrial segments accounted for the third, fourth and fifth largest categories for the period.

H1 2022 Great Lakes middle market M&A transactions / Number of transactions by industry sector (1) (2)

H1 2022 Great Lakes middle market M&A transactions, Number of transactions by industry sector

Source: S&P Capital IQ
(1) Includes only transactions with disclosed enterprise value between $10 million and $1 billion.
(2) Percentages may not total 100% due to rounding.

Get the full picture

For an in-depth look at M&A activity in the Great Lakes region, download a copy of the Great Lakes regional M&A update H1 2022. The report includes:

  • Regional market activity
  • Transaction data for middle market M&A activity
  • M&A activity by market segment
Team working on report
Mergers and acquisitions reports

See more M&A reports

Baker Tilly Capital professionals develop mergers and acquisitions (M&A) updates in different industries and regions. These reports provide an overview of M&A activity, including:

  • M&A activity by market segment
  • Transaction data for middle market M&A activity
  • Buyers and targets by location
  • Notable transactions closed during the period of the report
Students walking to class on a college campus in the spring
Next up

Environmental health and safety in higher ed – how institutions can implement internal controls to protect their communities