
Article
Microsoft Fabric: Data pipelines
Introduction to Data Factory pipelines
Data Factory pipelines in Microsoft Fabric are used to orchestrate data ingestion and transformation tasks.
In this three-part blog series learn how data factory pipelines in Fabric can be leveraged to orchestrate data movement and transformation activities, how a metadata driven framework can streamline your pipeline process and how to capture pipeline audit data for monitoring your pipeline runs.
Following this framework will increase efficiency in your Fabric pipeline management and provide visibility into your pipeline run history.
Create a Data Factory pipeline in Fabric
To get started, let’s go through how to create a data factory pipeline. Before creating a pipeline in Fabric, make sure you have the following in place:
- An active subscription to a Microsoft Fabric tenant account
- A Microsoft Fabric enabled workspace
- Sign into the Power BI service
- First, navigate to the Power BI logo in the lower left-hand corner of your Power BI service screen and select the "Data Factory" option.
- Then select the “Data pipeline” menu where you will be prompted to name your pipeline. Hit “Create”. You will then be taken to the data factory pipeline screen.
Fabric pipeline copy
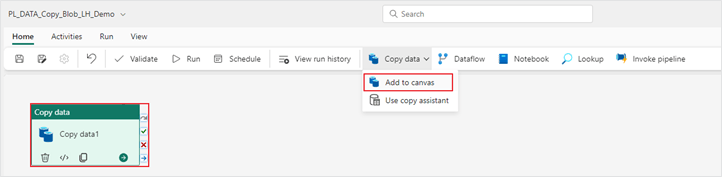
3. Now that you have your pipeline created, the next step is to add a “Copy data” activity. Under the “Home” ribbon, open the “Copy data” dropdown and select “Add to canvas”. Using this “Copy data” activity, data will be moved from a public blob storage account and ingested into an existing lakehouse in your Fabric workspace.
4. Next, under the "General" tab, adjust the configuration settings of the "Copy data" activity.
- It is recommended that you change the default timeout of 12 hours to a smaller amount, like 1 hour, so that your pipeline activities do not run longer than intended in case of a timeout.
- Increasing your retry count to something greater than 0 enables your activity to rerun automatically if there is a failure.
- Checking secure output/input in the advanced settings means that logging will not be captured for that pipeline run.
Your configuration settings should look like this:
- Name: Copy Blob to LH
- Description: Add description of pipeline activity
- Timeout: 0.01:00:00
- Retry: 3
- Retry interval (sec): 30
- Secure output: leave unchecked
- Secure input: leave unchecked
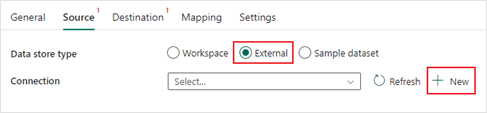
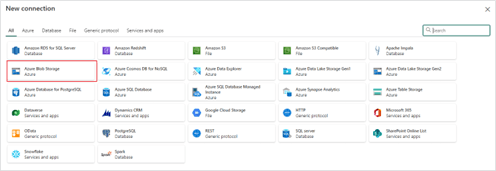
5. Next, under the “Source” tab, create a new connection to the blob storage account by selecting the “External” data source type and clicking the “New” button. This will populate a list of external source types, select Azure Blob Storage and fill out the connection settings.
Your connection settings should look like this:
- Account name or URL: https://azuresynapsestorage.blob.core.windows.net/sampledata
- Connection: Create new connection
- Connection Name: sampledata
- Authentication kind: Anonymous
6. Now that your data source connection has been made, continue filling out the “Source” settings in the “Copy data” activity. Your rest of your settings should look like this:
- File path container: sampledata
- File path directory: WideWorldImportersDW/parquet/full
- Recursively: check this box
- File format: Binary
7. On the “Destination” tab, select the lakehouse you want your files to land into. Your “Destination” settings should look like this:
- Data store type: Workspace
- Workspace data store type: Lakehouse
- Lakehouse: Your lakehouse name
- Root folder: Files
- File path: wwi-raw-data
- File format: Binary
8. In the "Settings" tab, leave all the default options selected. Hover over the ⓘ icon to learn more about each setting.
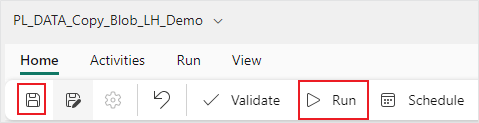
9. Now that your copy activity is configured you can save and run your pipeline.
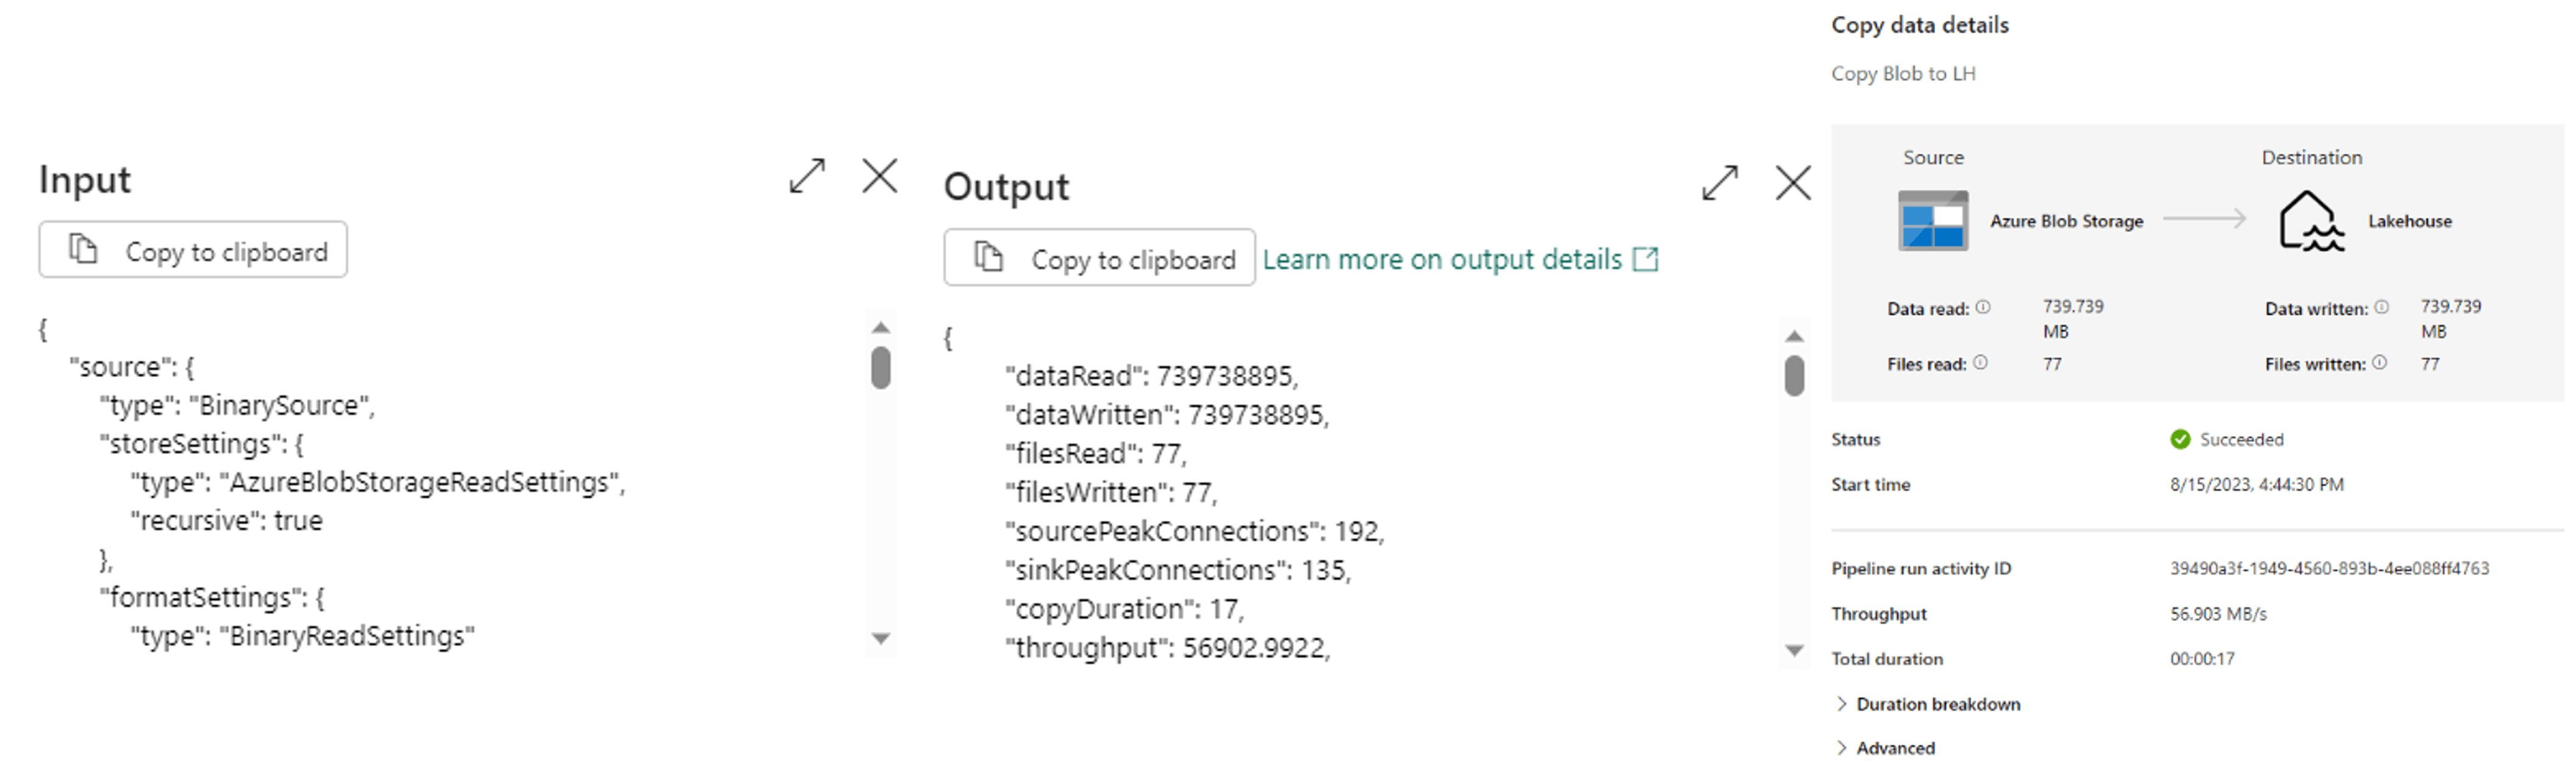
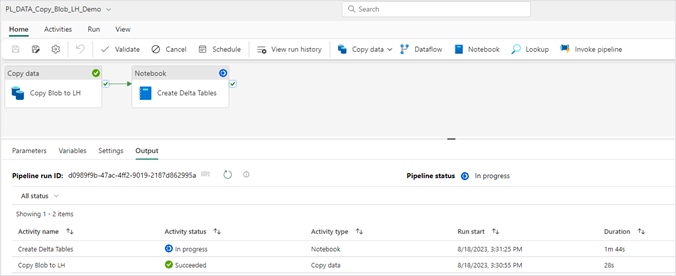
10. In the “Output” tab of your pipeline, under “Activity” name, you can monitor your pipeline run and see the status of each activity in your pipeline.
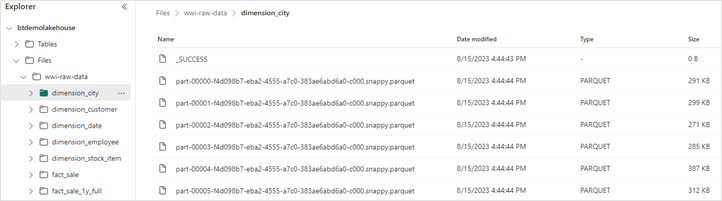
11. To confirm the files have been loaded to your lakehouse, open your lakehouse and check to see if all the files are listed under “Files/wwi-raw-data.”
Fabric Pipeline copy
Fabric pipeline notebook activity
12. Now that you have your data in your lakehouse the next step is to convert these files into delta tables so that you can begin to query this data for analysis. One way to convert your lakehouse files to delta tables is through a notebook. Below is a PySpark notebook that converts the fact and dimension table files into delta tables.
Cell 1 configures the spark session.
spark.conf.set("spark.sql.parquet.vorder.enabled", "true")
spark.conf.set("spark.microsoft.delta.optimizeWrite.enabled", "true")
spark.conf.set("spark.microsoft.delta.optimizeWrite.binSize", "1073741824")
Cell 2 defines our fact sale table and partitions the data based on the year and quarter columns that have been added.
from pyspark.sql.functions import col, year, month, quarter
table_name = 'fact_sale'
df = spark.read.format("parquet").load('Files/wwi-raw-data/full/fact_sale_1y_full')
df = df.withColumn('Year', year(col("InvoiceDateKey")))
df = df.withColumn('Quarter', quarter(col("InvoiceDateKey")))
df = df.withColumn('Month', month(col("InvoiceDateKey")))
df.write.mode("overwrite").format("delta").partitionBy("Year","Quarter").save("Tables/" + table_name)
Cell 3 loads the dimension type tables through a custom function.
from pyspark.sql.types import *
def loadFullDataFromSource(table_name):
df = spark.read.format("parquet").load('Files/wwi-raw-data/full/' + table_name)
df.write.mode("overwrite").format("delta").save("Tables/" + table_name)
full_tables = [
'dimension_city',
'dimension_date',
'dimension_employee',
'dimension_stock_item'
]
for table in full_tables:
loadFullDataFromSource(table)
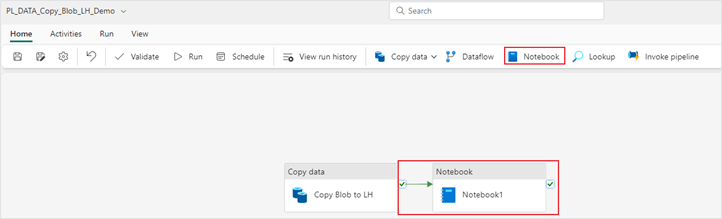
13. After creating the notebook, navigate back to the pipeline window and add a “Notebook” activity to your existing pipeline. Drag the “On success” green arrow from the “Copy data” activity to your “Notebook” activity.
14. Next, configure your “Notebook” activity. On the “Settings” tab add the notebook you created earlier in the steps above. Your “General” tab should look like this:
- Name: Your notebook name
- Description: Add a description of what your notebook is doing
- Timeout: 0.01:00:00
- Retry: 3
- Retry interval (sec): 30
Your “Settings” tab should look like this:
- Notebook: Your notebook resource
- Base parameters: None to add in this example, however these can be filled in if applicable.
Read here on more detail for passing notebook parameters into data factory pipelines.
15. Now that your “Notebook” activity is configured, save and run your pipeline.
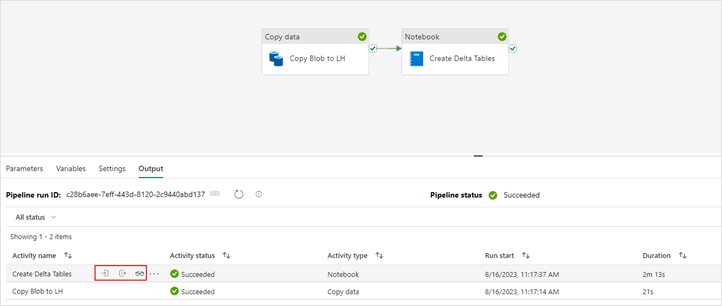
16. With a “Notebook” activity you are able to view a snapshot of the notebook that was executed in the context of the pipeline run.
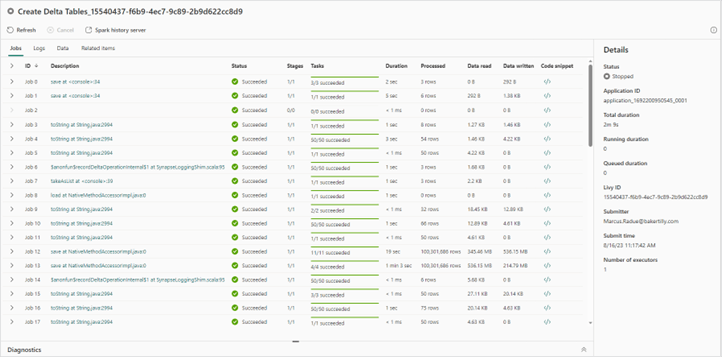
Fabric Pipeline notebook activity
Congratulations!
You have successfully created a data factory pipeline in Microsoft Fabric that copies blob storage files into a lakehouse and creates delta tables from those landed files. Continue to learn how to orchestrate and nest pipelines together.
Fabric pipeline orchestration
Invoking one or more pipelines from a single pipeline is a concept referred to as pipeline nesting.
- To get started, navigate to the Power BI logo in the lower left-hand corner of your Power BI service screen and select the Data Factory option to create a new data pipeline. The name of the pipeline can be “PL_ORCH_Demo”.
- Once your pipeline is created you will want to add an “Invoke pipeline” activity.
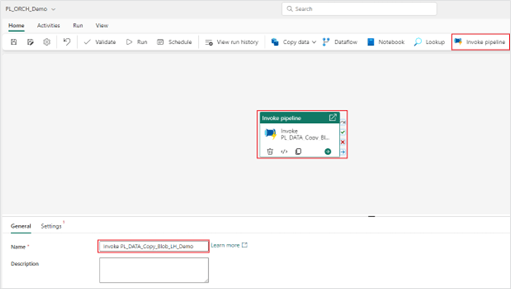
3. In the “Settings” tab, select the invoked pipeline from the drop-down menu. It is recommended to keep the “Wait on completion” setting checked.
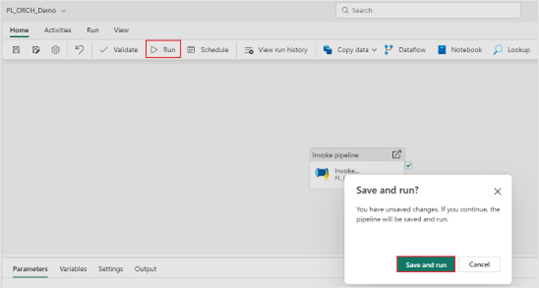
4. Now that your “Invoke pipeline” activity is configured, save and run your pipeline.
5. During the pipeline run of an invoked pipeline activity, you can drill into the nested pipeline run.
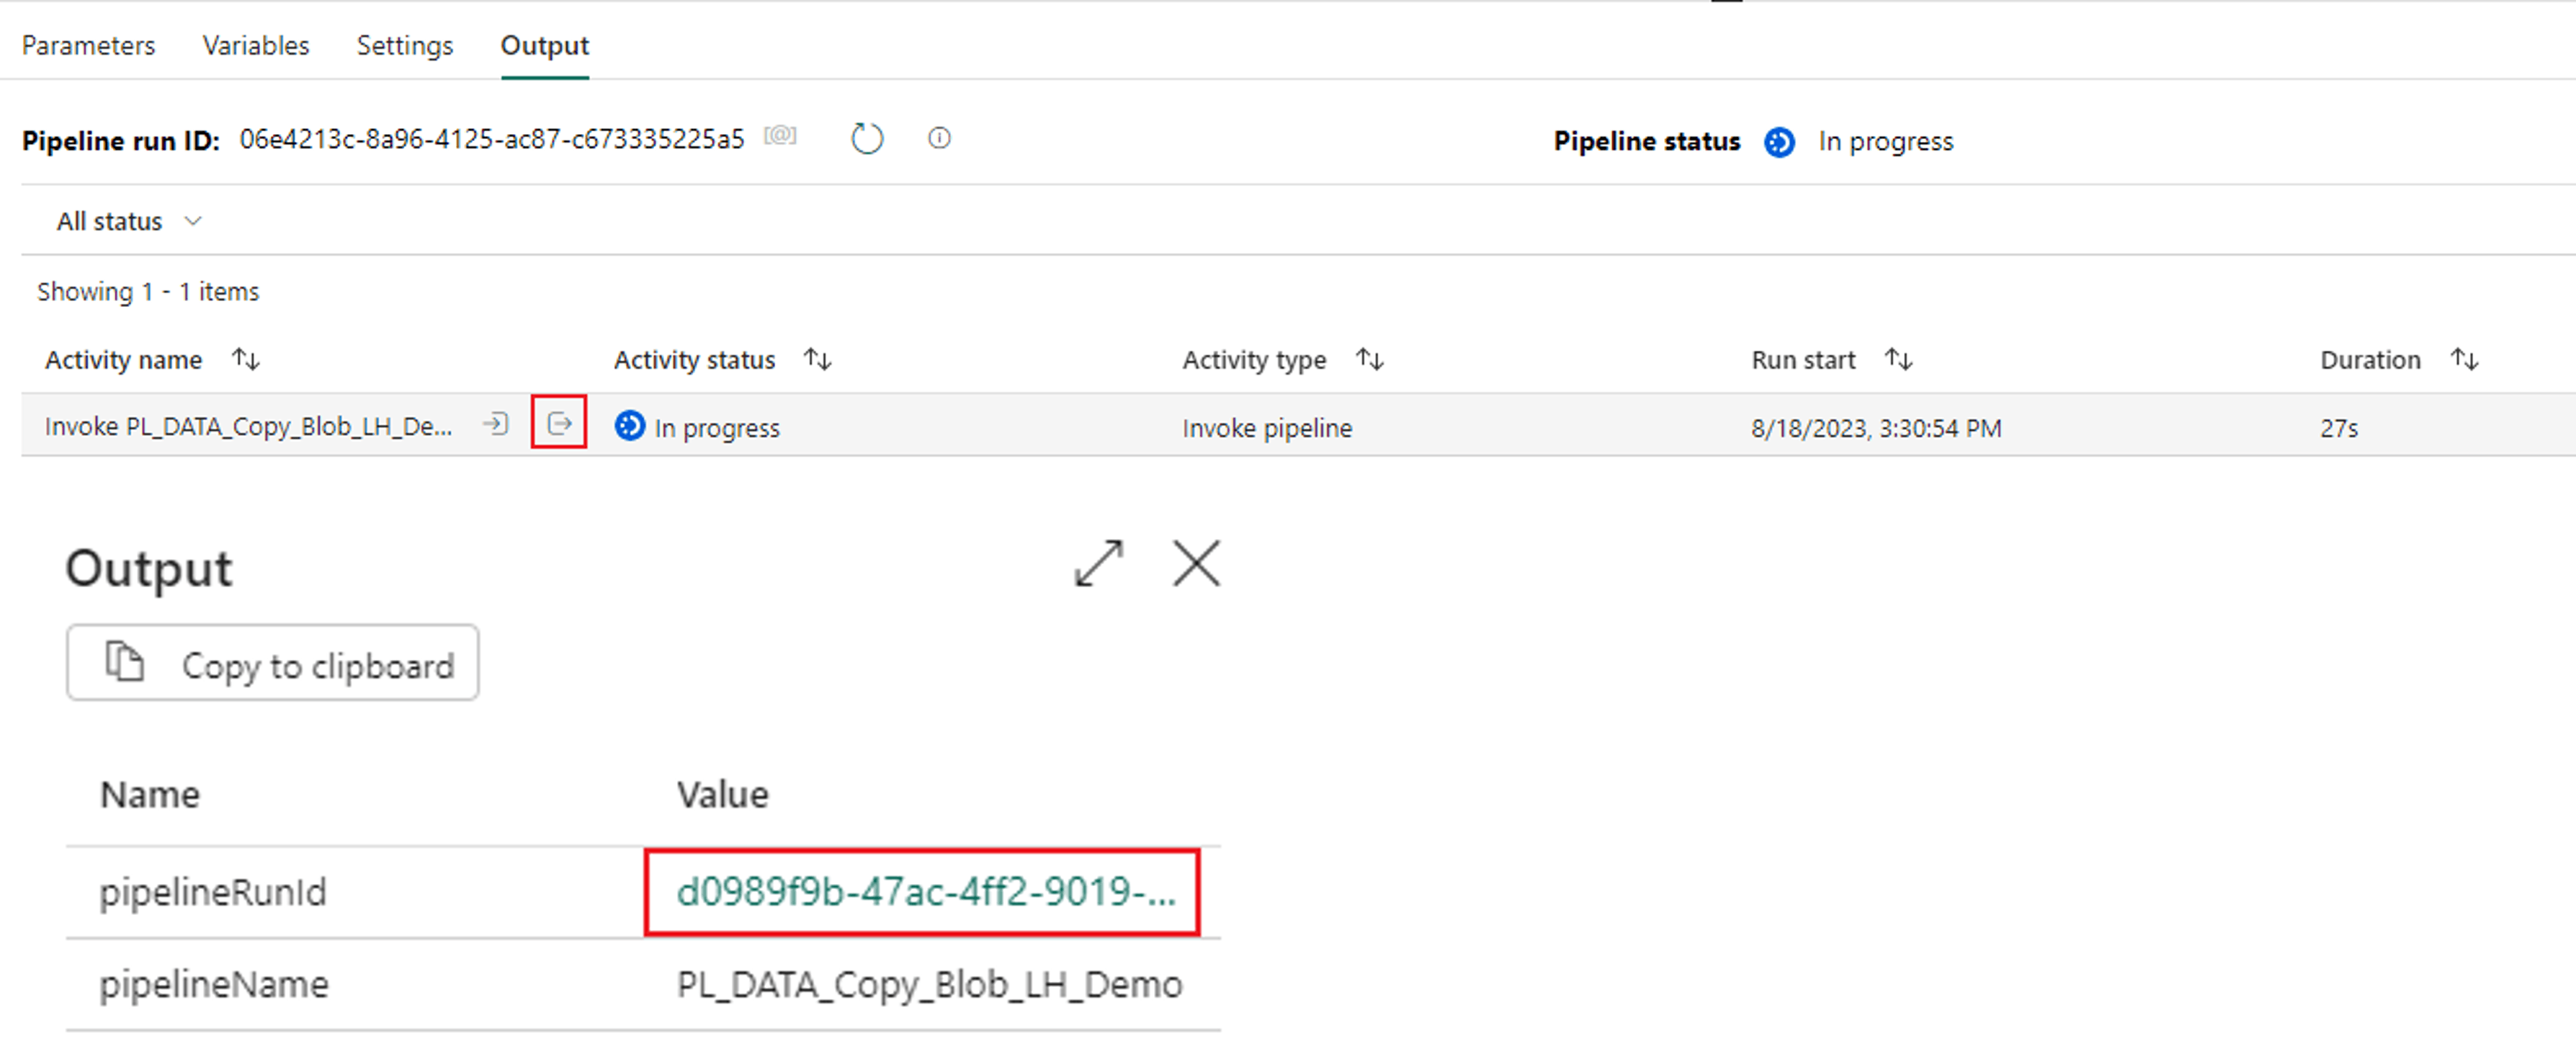
6. Notice each step of the nested pipeline is listed in the output window, giving you full visibility from your top-level pipeline down to your nested pipelines and their activities.
Congratulations!
You have successfully created an invoked pipeline activity in your data factory pipeline. This feature unlocks a number of possibilities in how you can organize your pipeline processes to follow a sequential order of activities. Continue on to learn how to add a schedule to a pipeline.
Fabric Pipeline orchestration
Add a schedule to a pipeline
Adding a scheduled run frequency for your data factory pipelines is an important next step for finalizing your configuration.
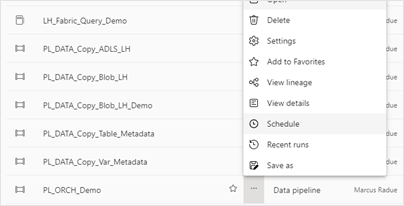
- To add a schedule to an existing pipeline, select the “Schedule” menu option in the “Home” ribbon.
- Next, configure the schedule settings. In the frequency dropdown you will have the option to repeat by the minute, hour, day and week. After you have configured your settings, select “Apply” to save the schedule.
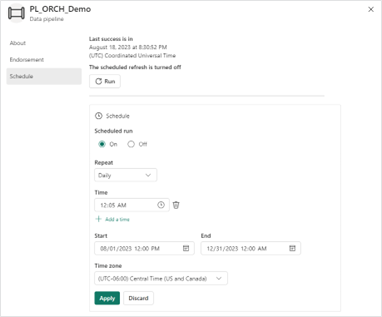
3. Through the Microsoft Fabric workspace menu, you can navigate back to your pipeline schedule to make any future changes or remove the schedule.
Congratulations!
You have successfully added a schedule to a pipeline. Check out part two of this blog series where we will cover how to capture pipeline audit data and create a metadata driven framework for your pipeline processes.
Interested in more Microsoft Fabric training videos? Check out the full line-up here!
