
Article
Solid foundations with room for growth: 2026 Telecommunications Benchmarking Study
June 23, 2026 · Authored by Clay Sturgis and Justin Wardle
The Baker Tilly Telecommunications Benchmarking Study shows that communications carriers studied ended 2025 well positioned with fiber to the home facilities and sound balance sheets. Annual revenues improved from the previous year, though at a slower rate than prior years, and operating profitability faced some fade. The communities, primarily served by rural carriers, continue to demonstrate demand for reliable, high-speed broadband and other communications services. However, customer growth rates declined for the fifth consecutive year and average revenue per broadband customer increased nominally, impacted by competition that has entered the residential broadband marketplace in earnest.
This year’s benchmarking study provides important data and takeaways influenced by this economic landscape that can empower your business to assess where it ranks against other telecommunications companies in key industry areas. Explore an overview of survey findings below.
2026 benchmark methods
The study compiled 2025 operational and financial data from approximately 80 companies. Other years shown followed a similar process, but the composition and number of companies changed, thus each year is an independent analysis.
Participants came from across the country and included a nearly even mix of cooperatives and privately held businesses. Additionally, approximately two-thirds of participating companies were under legacy rate-of-return support, with approximately one-third under model-based support—ACAM I, ACAM II, E-ACAM, or Alaska Plan.
Participating companies
The following table provides a summary of the range of size of the study participants.

The study defines a customer connection as a physical connection that provides service to a residential or business customer.
Often, one customer connection provides multiple services such as voice, broadband, and video; however, for the purposes of the study, such instances are counted as one connection regardless of the number of services a single customer connection might carry.
This review of the benchmarking data focuses on:
- Financial Position
- Broadband
- Profitability Analysis
- Universal service funding impacts on profitability
- Labor and staffing efficiency
Financial position
Participants continued to show a strong financial position. The following charts show the median asset distribution and median liability and equity distribution for participants in the study.
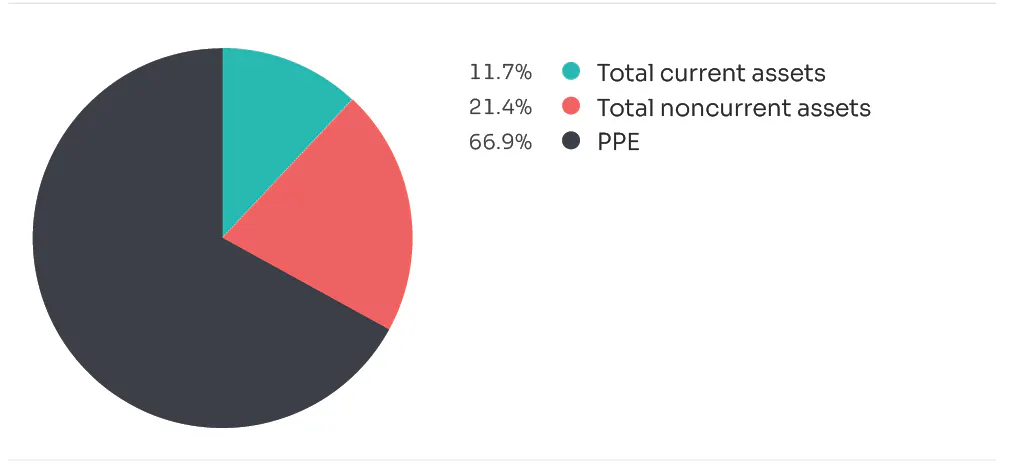
As expected, property, plant and equipment remained the largest component of the median asset distribution for participants in the current year, reflecting the industry's ongoing capital investments to support service delivery. Total current assets represented 11.7% of the median asset distribution, down slightly from 13.4% in 2024.
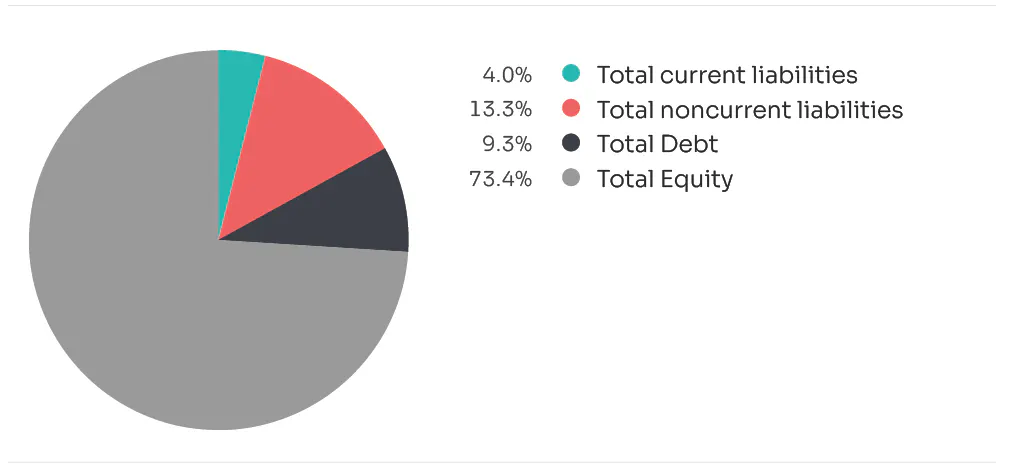
Participants’ substantial equity base provides greater resilience during economic downturns, allowing companies to better absorb losses and maintain operations when revenues are under pressure. Most study participants appear to be well-capitalized, financially stable and positioned with considerable flexibility to support future growth initiatives or withstand industry challenges.
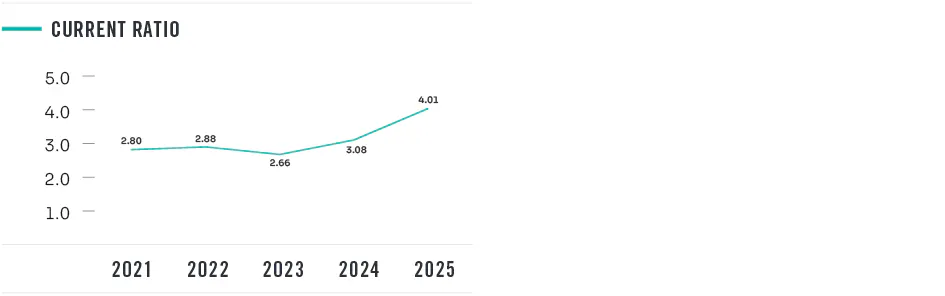
Liquidity remains strong among this year’s study participants. The five-year period shown below demonstrates a clear upward trend, with the median current ratio, defined as current assets divided by current liabilities, over that period showing strengthening liquidity and a greater ability to meet short-term obligations providing additional financial flexibility and stability.
Broadband
The availability and reliability of high-speed broadband continue to be essential to life in the United States. Broadband revenues in 2025 grew to 31% of total operating revenues, doubling from where it was in 2018.
Broadband connectivity continues to reduce barriers to remote work, education, commerce and entertainment, allowing individuals and businesses to overcome geographic limitations and operate with more flexibility.
Broadband growth and analysis
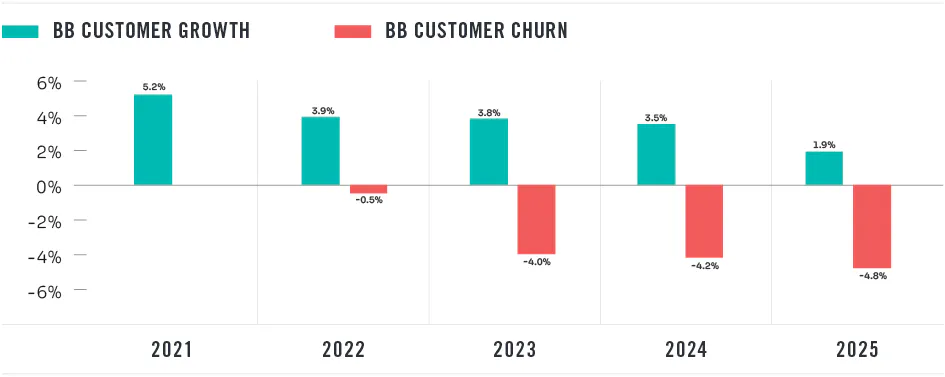
While broadband revenues are a significant component of financial operations, the headwinds of competition and likely demographic changes in some cases, have slowed broadband customer growth and increased customer churn rates over the last five years. Since the pandemic spike in 2020, customer growth has steadily declined with 2025 showing the lowest year-over-year increase in the past decade we’ve studied.
The following table shows the broadband customer growth rates and customer churn rates dating back to 2021 (post pandemic bump), overlaid with the linear downward trend for each metric. Gross customer growth has been between 4.4% and 7.8% for the five-year period, but customer churn has eroded new customer gains. If this trend continues, churn could eventually outpace gross customer growth entirely, leading to stagnant or negative broadband customer growth.
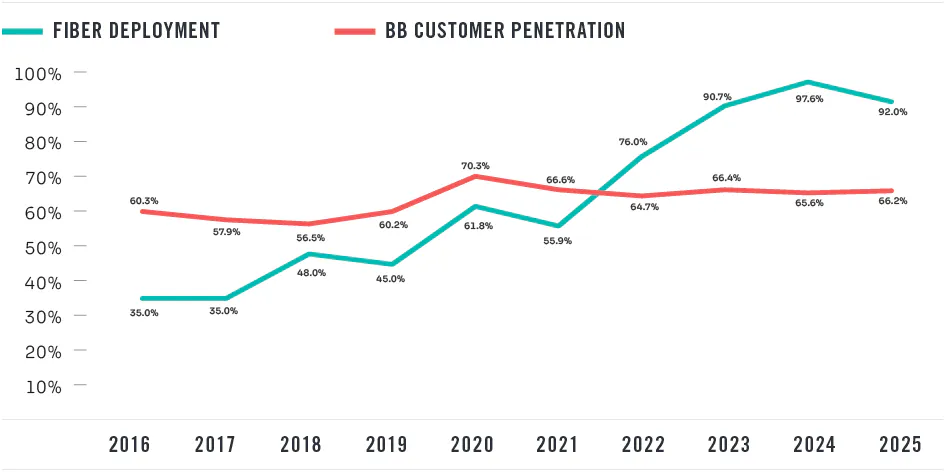
This declining growth rate trend runs contrary to the expansion of fiber infrastructure, which accelerated sharply around 2018. Fiber deployment has increased significantly, rising from 35% of all studied locations in 2016 to over 90% since 2023. In contrast, broadband customer penetration within the ILEC area has remained relatively stable, fluctuating within a narrow range between approximately 65% and 67% over the last 5 years.
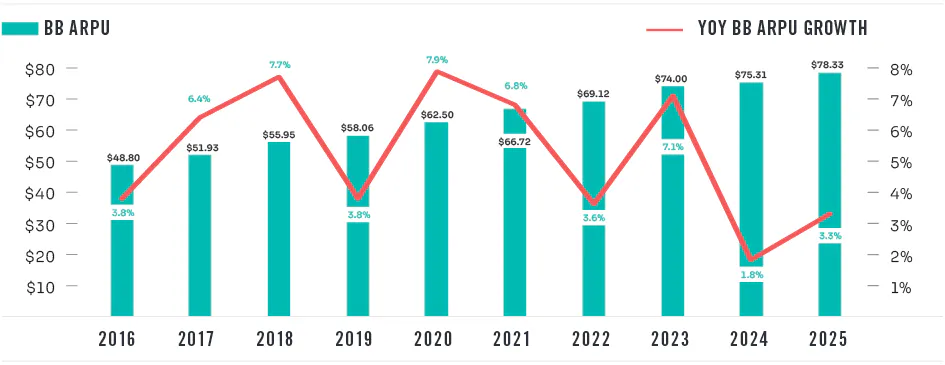
Despite the downward trend in customer growth, broadband average revenue per user (ARPU) has continued to rise steadily over the past decade, increasing from $49 in 2016 to $78 in 2025. Providers are generating more revenue from existing subscribers through a combination of price increases, higher-speed service upgrades and the adoption of premium broadband packages. Year-over-year ARPU growth has remained positive each of the last ten years, demonstrating the industry’s ability to expand revenue without relying heavily on adding new customers. As broadband markets mature and subscriber growth stabilizes, providers appear increasingly focused on maximizing customer value and monetizing demand for faster, more reliable connectivity versus less expensive, lower speed options
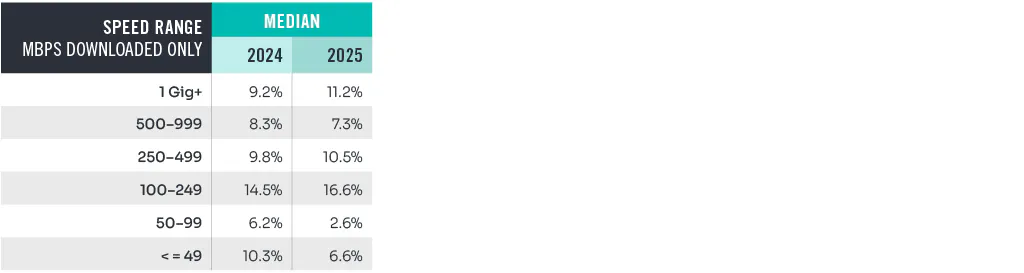
A more detailed look into the customer densities across various broadband speed-tier packages shows continued movement to higher-tier broadband products, particularly out of the sub-100 Mbps speed tiers.
Specific to the number of speed-tier service combinations offered by companies, the median company reported offering four combinations, with over 75% of all companies reporting three to seven offerings. By contrast, in 2020 the median company reported offering 12 speed-tier combinations, with over 75% of all companies reporting 8 to 24 offerings.
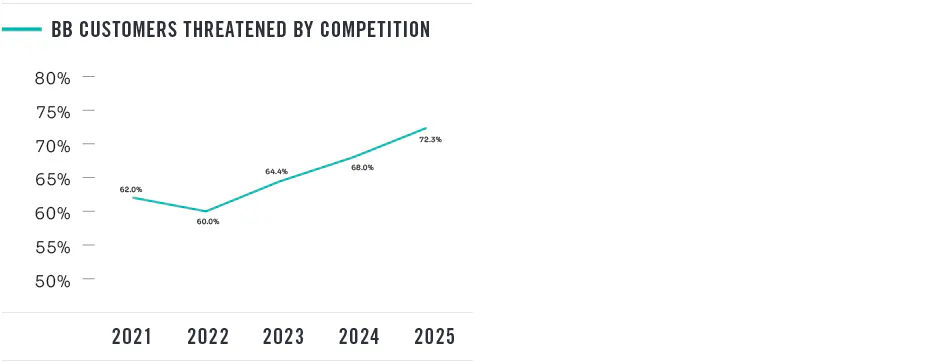
The following graphic shows the percentage of broadband customers threatened by competition from terrestrial broadband providers and excludes low earth orbit satellite competitors, which are also a capable threat. Since we began tracking this metric, it has steadily increased from 62% in 2021 to 72% in 2025. Competitive metrics reflect expanding availability of fiber and other terrestrial-based broadband services. This trend indicates that a growing share of broadband customers now have access to alternative providers, increasing competition within the market.
Profitability analysis
During 2025, there was a decline in median revenues for both companies on model-based support and legacy rate-of-return carriers. Model-based providers continued to have higher revenue growth rates and showed a consolidated net income of 16.7% of total operating revenues as compared to 15.6% from legacy rate-of-return carriers. This continues the trend that we saw of model-based companies having slightly higher revenue and profitability metrics for the first time in 2024.
The graph below shows the median year-over-year growth in operating revenue from 2018 through 2025, which illustrates the differing growth rates.
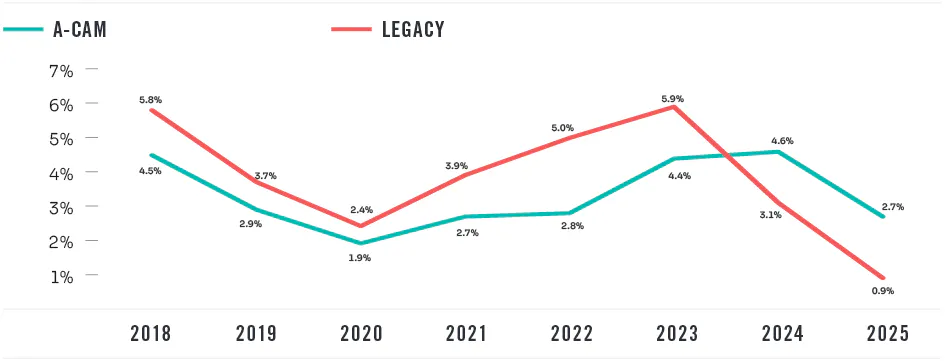
This difference is more pronounced, especially in recent years, by the flat growth rate in traditional wireline revenues for both types of companies—voice, wholesale broadband, access and universal service support—as opposed to broadband revenues and other communications services. This seems to indicate that model-based carriers have grown internet and other diversified revenue streams at a much quicker pace to overcome the lower growth rates in traditional wireline services.
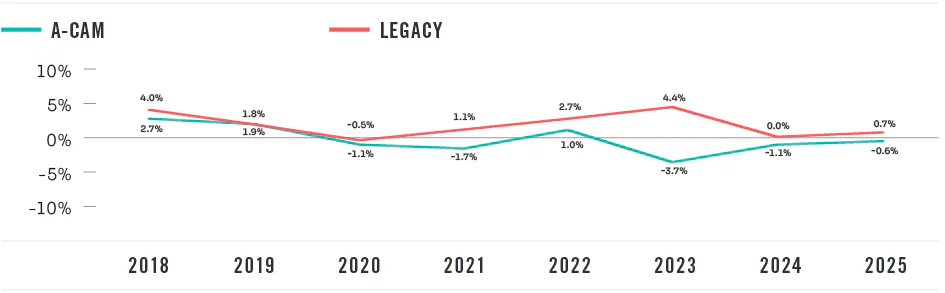
From an expense perspective, total operating expenses (including depreciation) for legacy rate-of-return carriers and model-based providers increased 2.4% and 3.9%, respectively, from 2024 to 2025. For the first time in five years, operating expense growth for both sets of providers was under 4%. This Indicates that some of the previous inflationary pressures we’ve noticed over the past five years have started to ease, along with operational and automation adjustments within the industry to increase efficiency and decrease operating expenses.
The graph below shows that median operating expenses for all companies in the study continued to exceed the total annual inflation rate published by the U.S. Bureau of Labor Statistics, however, narrowed the gap significantly in 2025.
Universal Service Funding (USF) impacts on profitability
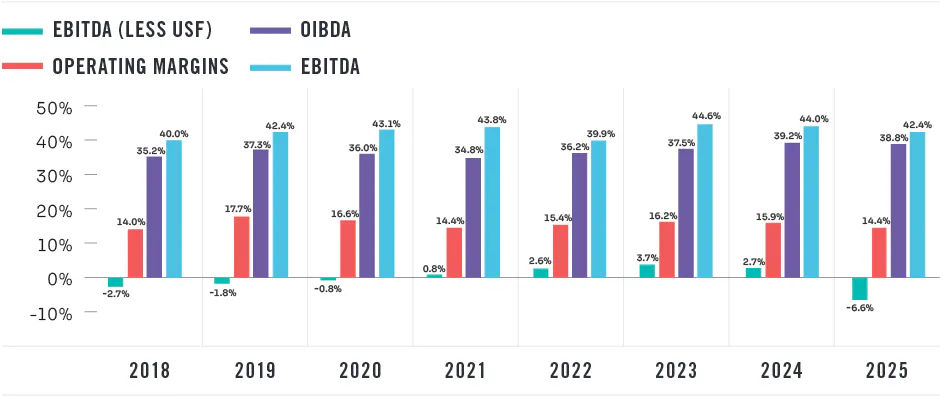
The median for all participants showed a 1.5% decrease in operating margin for 2025, following essentially being flat from 2023 to 2024. In addition, participants also saw earnings before interest, taxes, depreciation and amortization (EBITDA) decrease for the second year in a row. EBITDA is a metric used to evaluate a company’s fundamental operating performance by excluding the effects of financing and accounting decisions. Although not recognized under U.S. Generally Accepted Accounting Principles (GAAP), it is commonly used to offer a clearer view of a company’s ability to generate profit from its primary business activities.
Specific to USF, interest continues to be high in evaluating a company’s profitability, and overall enterprise value, excluding federal and state universal service support—EBITDA-less USF or controllable margins. In 2025, this metric declined to negative 6.6% after hovering near a positive 3% for several years. Part of the reason for the significant change relates to the composition of companies studied year over year; however, also likely due to expense growth outpacing revenue growth. The EBITDA-less USF metric for the 2025 study group, as indicated later in this article, stayed nearly flat, decreasing by .2%. Regardless, study results indicate heavy continued reliance on universal service and pressure on overall profitability.
Companies want to continue preparing for a future with less or no USF given the persistence of limitations on federal USF, such as:
- Budget control mechanisms
- Per line caps on support
- Expense limitations
- Changes to the programs
- Competition and broadband grant programs
- Other constraints
Operating income before depreciation and amortization (OIBDA) measures a company’s core operating performance by adding back depreciation and amortization to operating income, excluding non-operating items. In contrast, EBITDA also adds back these costs but may include certain non-operating income or expenses, making it a slightly broader metric. Operating margin, on the other hand, includes depreciation and amortization, highlighting how efficiently a company turns sales into operating profit. While all three metrics assess profitability, OIBDA and operating margin focus more strictly on core operations, whereas EBITDA can be influenced by financing and other non-operating factors.
The graph below shows the median company’s profitability figures along with controllable margins for the past eight years.

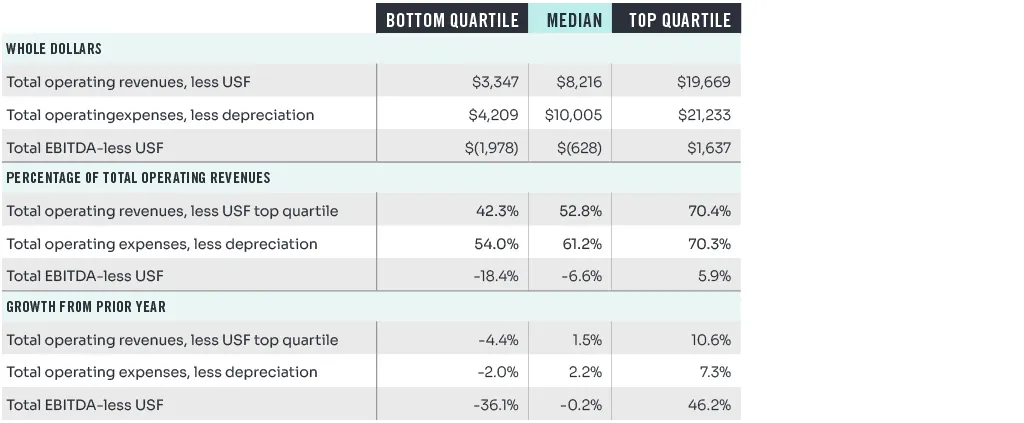
The following table provides more details including median values in the bottom and top quartiles – all dollar figures are shown in the thousands.
Labor and staffing
Staffing costs have long been the largest cash expense for communications carriers studied.
Direct labor costs—gross salaries and wages, employee benefits, payroll taxes, bonuses—represented between 28% and 33% of total revenues and between 35% and 37% of total expenses for the most recent six-year period.
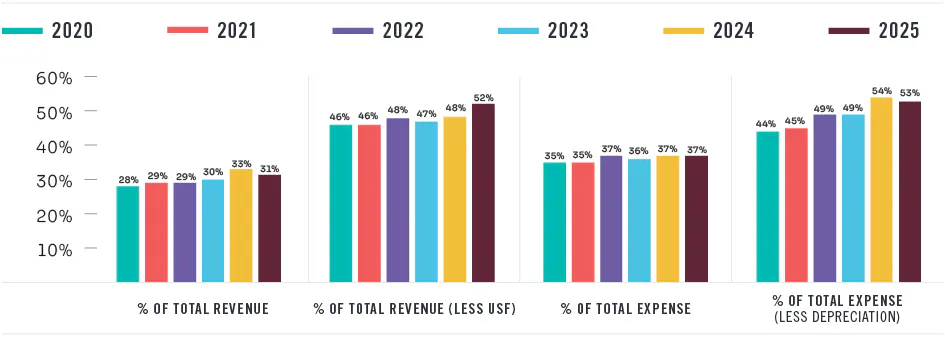
Perhaps most notable is that the median company shows that total labor costs reached 52% of its total operating revenue less USF in 2025.
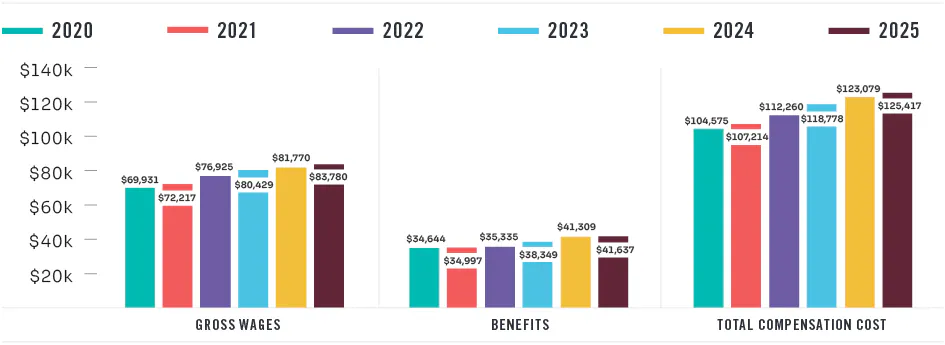
On a more individual level, the average compensation costs per employee (gross wages plus average benefit costs per employee) slowed in 2025. This may indicate 2025 showing the industry returning to pre-pandemic levels. Additionally, benefits remain approximately 50% of gross labor and consistent with the years we’ve conducted this study.
The following table details the per employee costs for the past six years.
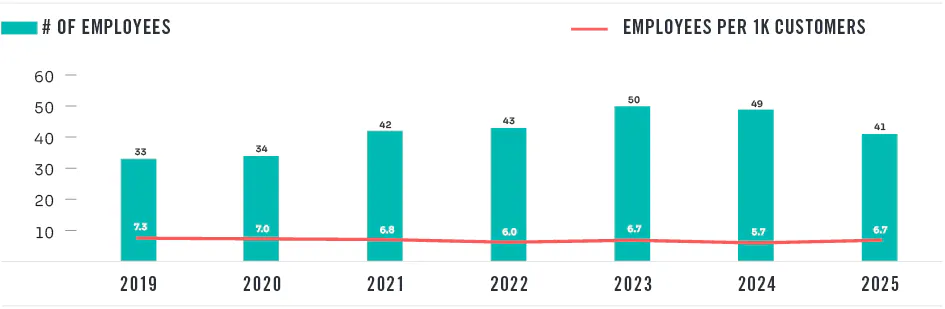
Staffing efficiency
The efficient use of staffing resources is an important management focus. The benchmarking study traditionally used revenue per employee to compare employee efficiency across study participants; however, USF support revenues, and other revenues that aren’t necessarily employee-driven, especially for model-based providers, can influence that outcome. The metrics below compare the number of employees to customers—essentially answering the question: How many employees does it take to serve 1,000 customers?
The graph below shows the median number of employees with the number of employees per 1,000 customers over the past seven years. As this number dropped from 7.3 employees per 1,000 customers in 2019 to 6.7 in 2025, the data appears to support that companies have realized small efficiency gains in serving customers over the past several years.
We’re here to help
For more insights on how your company can navigate the current telecommunications landscape, contact your Baker Tilly professional.

