


Cost Containment in Healthcare: Service Line Data Signs®


Debra K. Bowes
CPA
Partner

David A. Gregory
Principal

Heather L. Herc
Director

Michael J. Patti
Principal

Mark Ross
CPA
Partner
Service Line Data Signs® is an easy-to-use analytics tool that gives healthcare providers the ability to view encounter and claims data grouped by service line at both an executive summary and granular level.
By being able to visualize and drill down into specific datasets, providers can easily pinpoint cost containment in healthcare and identify revenue. They are also able to improve contract reimbursements and quickly make changes and decisions with confidence that can help propel them on their path to financial sustainability.
Paving the way to financial sustainability
Hospitals and health systems of all sizes are navigating operating margins that are tighter than ever before. Organizations are also operating under compressed revenues, reductions in elective procedures, consolidation within the industry, shifts in insured populations and an increased focus on quality of care. Because of this, it is imperative to take a proactive approach to monitor the financial well-being of the organization.
Powered by MedeAnalytics, Baker Tilly’s Service Line Data Signs is able to help healthcare providers quickly identify and target opportunities to optimize service line level financial performance, implement cost containment in healthcare and improve operating margins.
Discover the benefits of Service Line Data Signs
Service Line Data Signs is not solely for use by executives and finance professionals; its easy-to-use format allows clinical team members to access, share and understand service line profitability so that organizations have a comprehensive approach and understanding of how to become financially sustainable. By being able to review data from a high-level overview as well at the detailed level, organizations can utilize Service Line Data Signs to its full capacity in order to maximize cost containment initiatives through:
Performance analysis
Identifying top and bottom performing service lines within the organization to drive short- and long-term strategies
Structured case type
Recognizing physician ordering patterns by encounter/case type to allow for potential purchasing consolidation by supply type or item
Maximize revenue
Drawing attention to potential revenue shortages that are contributing to negative service line margin performance
Detailed analytics
Establishing physician-level utilization and related costs to help determine high-cost Diagnosis Related Groups (DRGs)/procedures in tandem with patient/encounter severity to allow internal benchmarking and improvement initiatives
Key features of Service Line Data Signs
Many unique aspects to Service Line Data Signs help our clients discover, optimize and sustain opportunities for their organization to become financially healthy. Some of these unique features include:
Service Line Data Signs provides organizations with customizable, executive-level reports, dashboards and infographics that are easy to interpret and understand, providing quick summary-level insight into applicable business problems and questions.
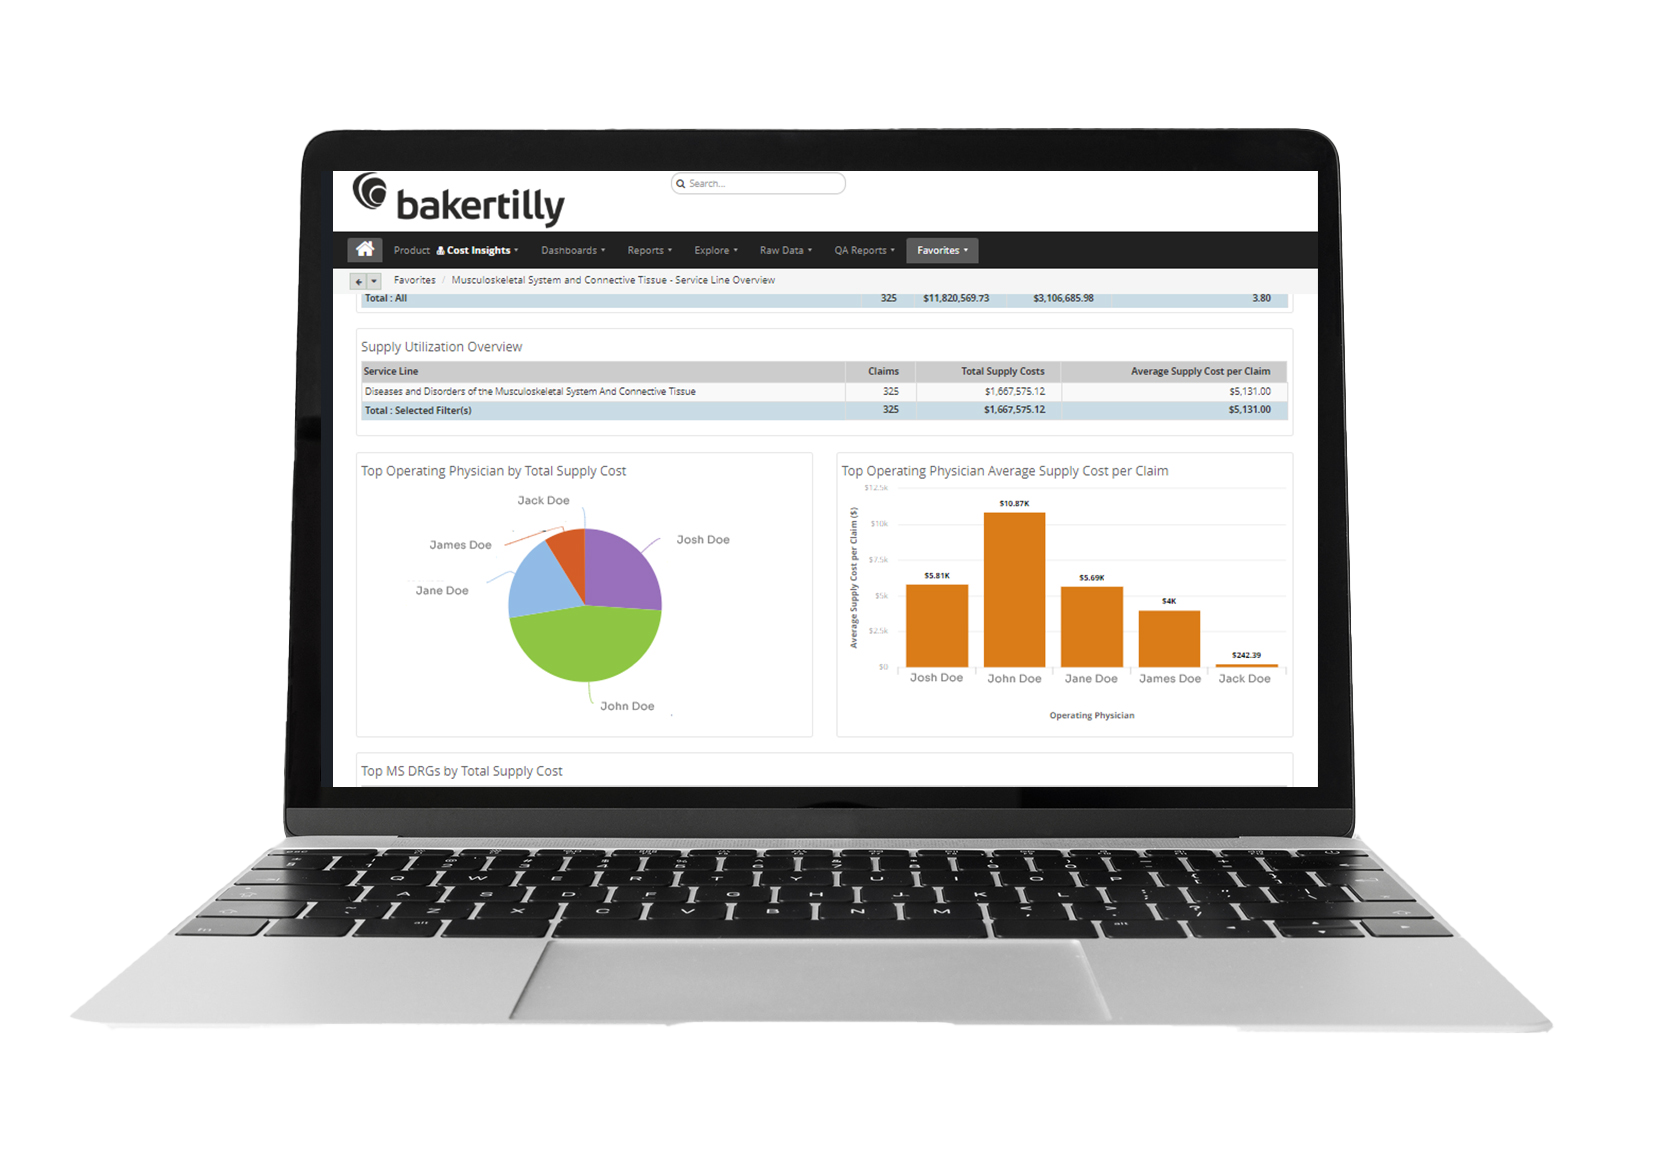
From the executive-level summary report or dashboard to margin reporting, organizations have the ability to conduct ad-hoc exploration to drill down into key performance indicators (KPIs), including:
- Revenue-based KPIs: Total and average charges, payments and denials; admissions and discharges, etc.
- Expense-based KPIs: Total and average supply costs, Rx costs, line item costs, etc.
- Additional KPIs: Readmits, charge to reimbursement ratios, DRG downgrades, case mix index, etc.
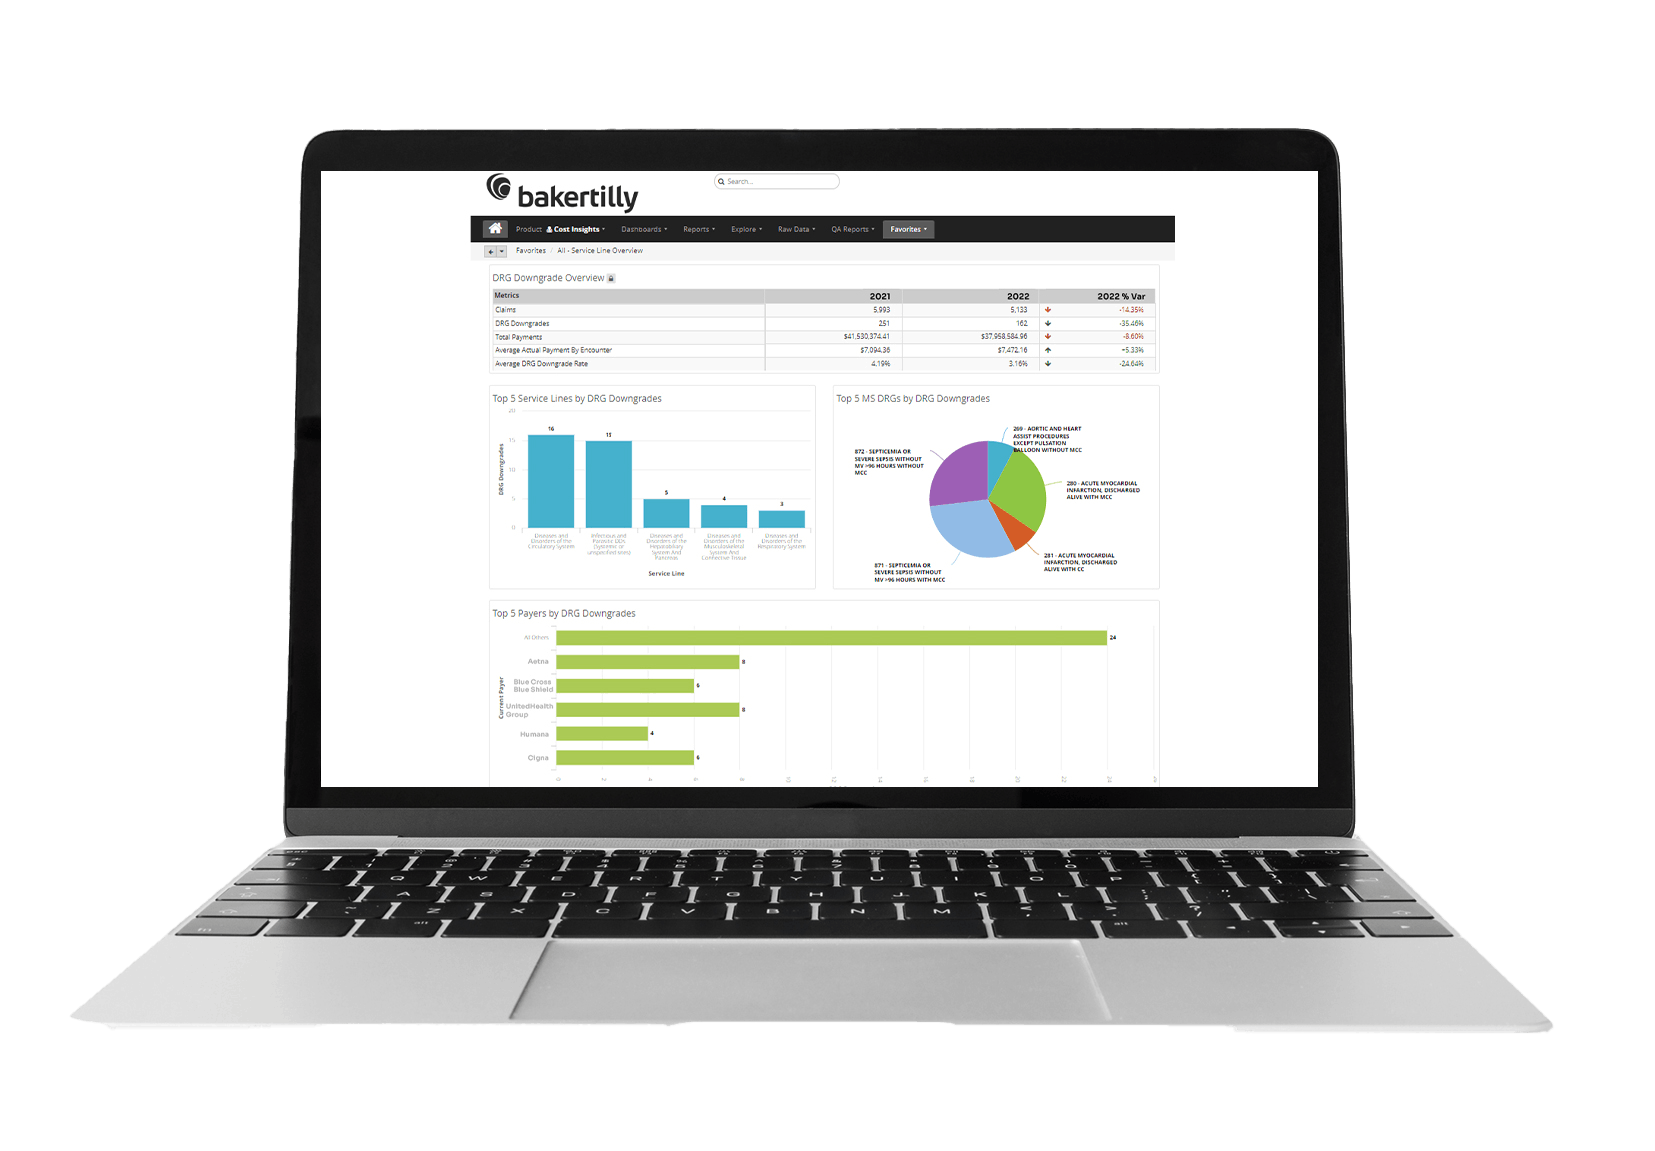
Service Line Data Signs utilizes various data sources to provide the most accurate understanding of the organization’s financial health. By including institutional datasets in our easy-to-use, one-stop-shop, organizations are able to drill down into:
- service lines
- primary diagnosis and procedural codes
- attending and operating physician data
- Medicare Severity-Diagnosis Related Groups (MS-DRGs)
- information about payers and reimbursements
Reports and infographics from the summary level to the granular level can be easily shared with others throughout the organization. Users also have the ability to customize the homepage to quickly find their favorite views as well as create and save personal alerts for monitoring key KPIs and trends. With Service Line Data Signs’ user-friendly format, any user is able to easily find and visualize the data they are searching for.
Because Service Line Data Signs is meant for providers of all sizes, Baker Tilly can offer organizations a variable degree of support depending on each entity’s resources and needs. Whether your organization wants self-service use to Service Line Data Signs to evaluate, drill down and identify ways to minimize costs, or if you need an outside resource from Baker Tilly to do the heavy lifting so you can focus on your organization’s mission-critical tasks, we are here to help and customize our solutions to fit your needs.
One thing missing from our healthcare system reporting was easily accessible cost data associated with our supplies and pharmacy expenses. With the help of Service Line Data Signs, we were able to dig deep into our data to identify and prioritize service lines to take action on, and confidently begin making the changes and decisions necessary to improve our overall profitability and patient quality.Hospital Chief Financial Officer
Featured insights

Sole community hospital reshapes financial outlook through service line analysis
Learn how Baker Tilly helped a community hospital overcome financial challenges by leveraging service line analytics and identifying cost-saving opportunities.
Baker Tilly and MedeAnalytics create cost-containment solution for healthcare providers
Collaboration leverages data to help healthcare providers improve margins by gaining transparency and actionable insights into direct, controllable costs and revenue.
Service line performance and profitability for healthcare providers
Watch our on-demand webinar for a panel discussion about identifying optimal service line performance and how to fix issues with less-than-optimal service line performance.
Healthy Outcomes: Cost containment strategies for hospital emergency departments
Listen to our podcast with hospital and health system C-Suite executives about how organizations can become, or remain financially sustainable through 2021 and beyond.