
Visualizing your data with Amazon QuickSight
Author: Neeraj Iyer
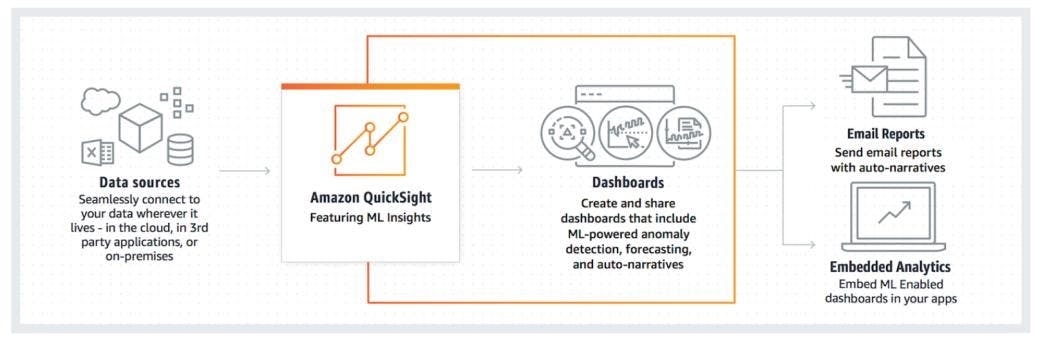
Amazon QuickSight is an Amazon Web Service (AWS) service built for the cloud that enables customers to visualize their data. Quicksight is used for creating and publishing dashboards that include machine learning (ML) powered insights which can be accessed from any device. The first article in this series explored what Amazon Quicksight is and the business intelligence it can provide. This second article in the series will dive into the functionality, features and capabilities of Amazon Quicksight.
Identifying the types of QuickSight users
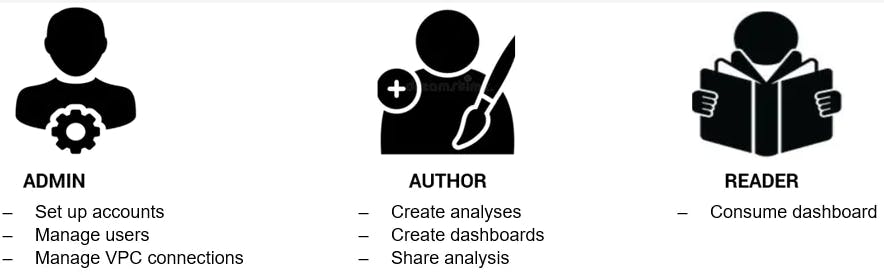
QuickSight provides multitenancy security where users are grouped into namespaces such as admin, author and reader, making QuickSight even more secure. A breakdown of the QuickSight users is as follows:
- A QuickSight admin has the highest privilege and can manage QuickSight user activities
- A QuickSight author is typically a business intelligence (BI) analyst, data engineer or data analyst who will create dashboards
- A QuickSight reader is an end user with view-only access to QuickSight dashboards
QuickSight data sources and use cases
The following data sources are supported by Amazon QuickSight:
- Relational data sources: Aurora, Athena, Elasticsearch, Redshift, S3, Spark, AWS IOT Analytics, Maria DB, MySQL, Oracle, PostgreSQL, Presto, Snowflake and Teradata
- Importing file data: XLSX, JSON, CSV, TSV, ELF and CLF
- Software as a service data: JIRA, ServiceNow, Adobe Analytics, GitHub, Salesforce, Twitter and Square
- Databases installed on Amazon EC2
- Local on-premises databases
- Data in a data center or some internet-accessible environment
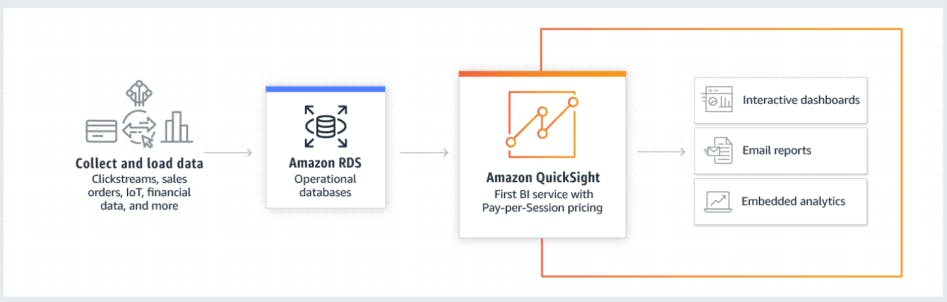
Connecting QuickSight to your data in an Amazon Relational Database Service (RDS)
QuickSight can be used with data imported from any database to create interactive dashboards.
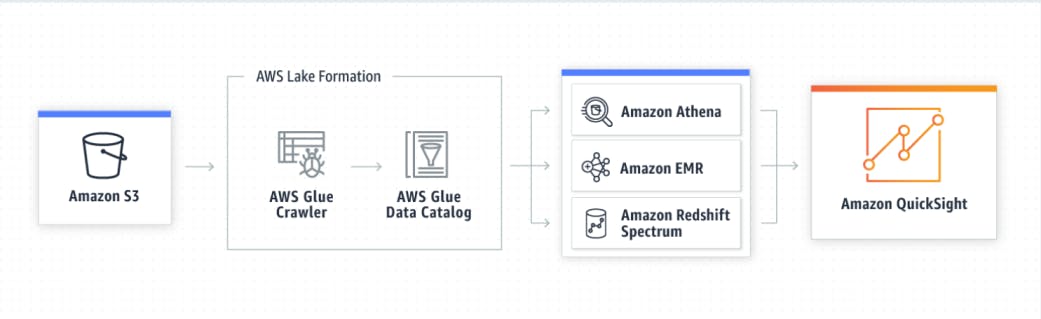
Connecting QuickSight to your data lakes
QuickSight uses an AWS glue crawler to fetch data from an S3 bucket and load it to the appropriate staging area like Amazon Athena, EMR and Amazon Redshift spectrum, before loading it into QuickSight to create interactive dashboards.
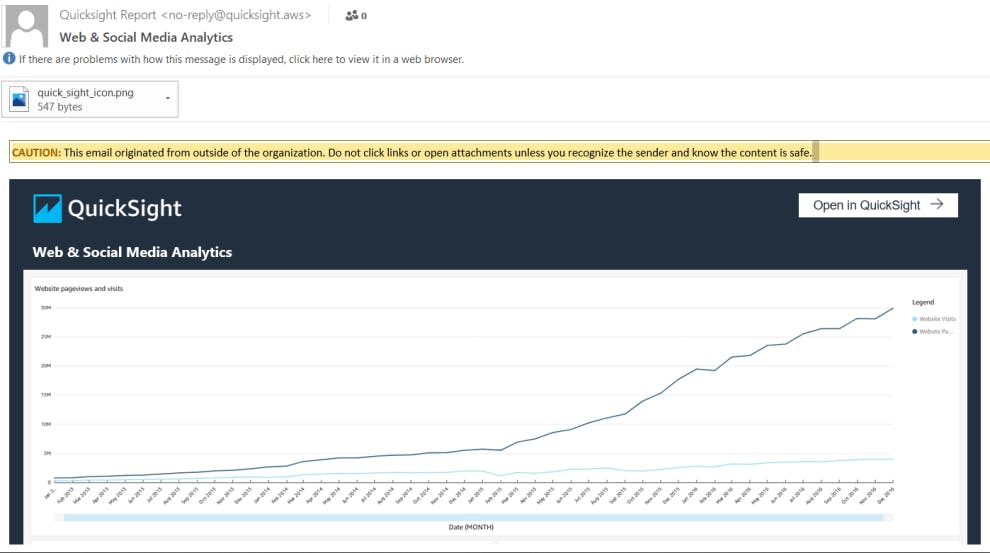
Dashboard and analysis sharing
Dashboards can be shared with users who have access to the QuickSight account. QuickSight provides secure sharing by restricting access to only users on the account or those to whom access is granted. Reports can be scheduled to be emailed to users on a monthly, weekly or daily basis, and can also be optimized for a desktop view or a mobile device. Below is a snapshot of a QuickSight dashboard email, the email title and body can be customized.
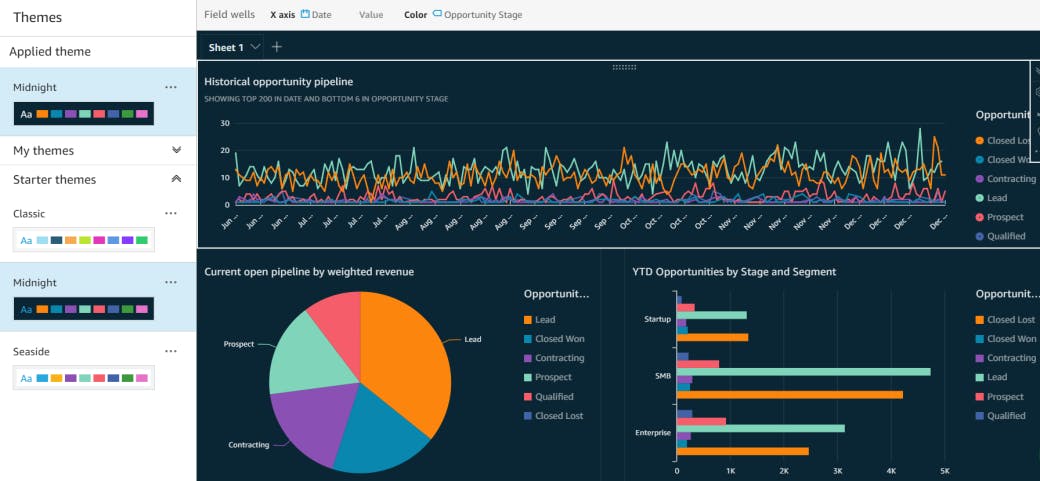
QuickSight themes
QuickSight themes is a powerful feature, enabling users to customize the look of visualizations to match brand guidelines or other preferences. Themes can be customized, edited, saved and shared with others. Data colors can be selected and saved for future analyses or dashboards. The background and foreground color and text fonts can also be preset and customized. Analysis visualizations can have only one theme applied at a time. QuickSight provides its own starter themes, but users can also create their own.
SPICE: In memory engine
SPICE is QuickSight’s Super-fast, Parallel, In-memory Calculation Engine. SPICE performs advanced calculations and the enterprise edition includes data encryption for all data stored in SPICE.
When data is imported from different data sources it can be imported into SPICE mode, instead of direct SQL query mode. This is particularly beneficial if the data includes complex calculations in the analysis as it will save time and overall costs. Every AWS region has an allocated SPICE capacity that is shared between all the people using QuickSight in a single AWS region. The QuickSight administrator can review SPICE capacity usage, purchase more SPICE capacity and also release unused capacity.
Build predictive dashboards with Amazon SageMaker
QuickSight integrates well with already-built models in Amazon SageMaker which can make it a faster, easier and cost-effective solution. Customers can import data from any data source and select the appropriate SageMaker model for prediction without having to write any code.
Machine learning (ML) Insights
QuickSight’s Enterprise edition supports ML Insights. These insights help customers understand data at a glance, share findings and inform better decisions to achieve goals. ML Insights leverages AWS’s proven ML and natural language capabilities to help customers gain deeper insights from their data. AWS’s out-of-the-box features make it easy to discover hidden trends and outliers, identify key business drivers and perform powerful what-if analysis and forecasting with no technical expertise or ML experience needed.
The data insights in natural language narratives can be embedded in dashboards. The forecasts, anomalies and factors contributing to these can also be viewed with auto narratives. Amazon QuickSight learns continuously so that it can deliver more specific insights. Customers can create a dashboard with no manual analysis, no custom development skills and no understanding of ML modeling or algorithms as all these capabilities are included within QuickSight.
Amazon QuickSight’s ML Insights provides three major features:
- ML-powered anomaly detection: Amazon’s proven ML technology analyzes all data to detect anomalies or outliers. This helps identify primary drivers of change in customers’ business metrics, such as a reduction in sales in a particular region, dip in website traffic or higher-than-expected web traffic.
- ML-powered forecasting: Nontechnical users can confidently forecast key business drivers with Amazon QuickSight. The random cut forest algorithm helps detect seasonal trends, outliers and missing values. Users can also interact with the data with point-and-click simplicity.
- Auto narratives: Auto narratives enables users to build rich dashboards with embedded narratives, telling a story of data in plain language. This saves time as users no longer need to look through charts and tables to extract key insights from data. Amazon QuickSight acts as a personal data analyst for all of its users.
QuickSight Q
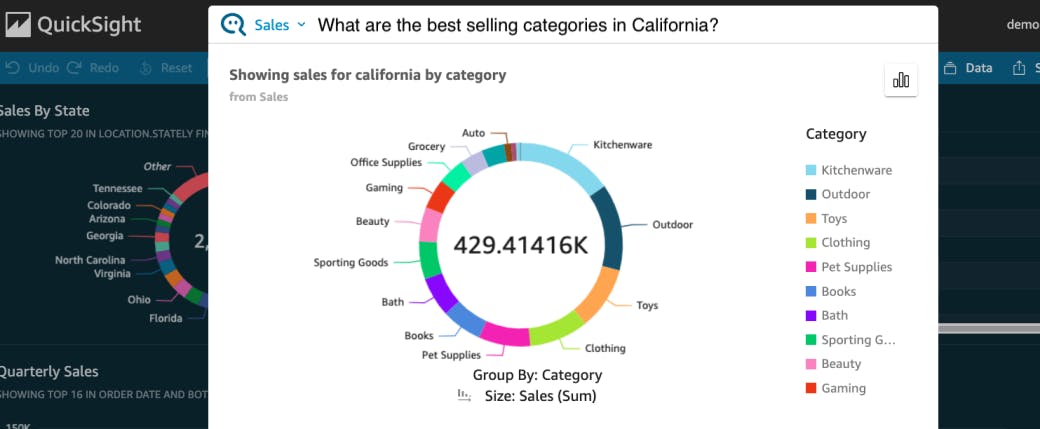
With QuickSight Q, users can ask questions of their data and receive answers in seconds. Amazon QuickSight Q is a ML powered capability that uses natural language processing to respond to business questions instantly, saving teams time in building pre-defined data models and dashboards.
QuickSight Q is optimized to understand business language, including phrases related to sales, marketing and retail or common phrases specific to a customer. For example, if a partner wants to know the sales in a particular region, they can simply ask “What are the best-selling categories in California?” QuickSight Q understands “best-selling” means highest revenue earned and returns the best-selling product categories in California by revenue. The accuracy of QuickSight Q increases the more it is used. Users provide feedback if results are not accurate and the BI team can revise the data model.
QuickSight embedded analytics
Many embedded analytics solutions on the market are expensive, time consuming to set up and resource intensive. Many solutions are also hard to scale and the price increases as the application scales, even with fewer features offered. But Amazon QuickSight’s embedded analytics allows customers to embed analytics without compromising on the ability to personalize the look and feel of new features.
With QuickSight’s embedded analytics, a dashboard or entire QuickSight experience can be embedded into existing applications. With this feature, rich interactive data visualizations and analytics can be viewed on customer applications without custom development. Specialized knowledge is not needed to develop or manage servers or a complex data engineering pipeline, which saves time and money. QuickSight embedded analytics enables users to perform advanced analytics with capabilities such as ad-hoc analyses and ML based insights. QuickSight’s serverless architecture helps scale insights with a growing user base as customers only pay for usage under QuickSight’s unique pay-per-session pricing model.
QuickSight offers a variety of Application Programming Interface's (API) to efficiently integrate dashboards into an application, manage use and group API operations and customize the entire experience. Users who view the dashboard on the application do not require user-facing QuickSight specific authentication. Users can also be added into groups and given access accordingly using the enterprise edition. Embedded analytics empowers users to discover actionable insights without the complexities of a separate BI tool.
QuickSight offers two API operations:
- GetDashboardEmbedUrl: API operation which embeds interactive dashboards into applications
- GetSessionEmbedUrl: API operation which embeds the QuickSight console or entire QuickSight experience into applications
The figure below displays how QuickSight dashboards can be embedded into existing applications.
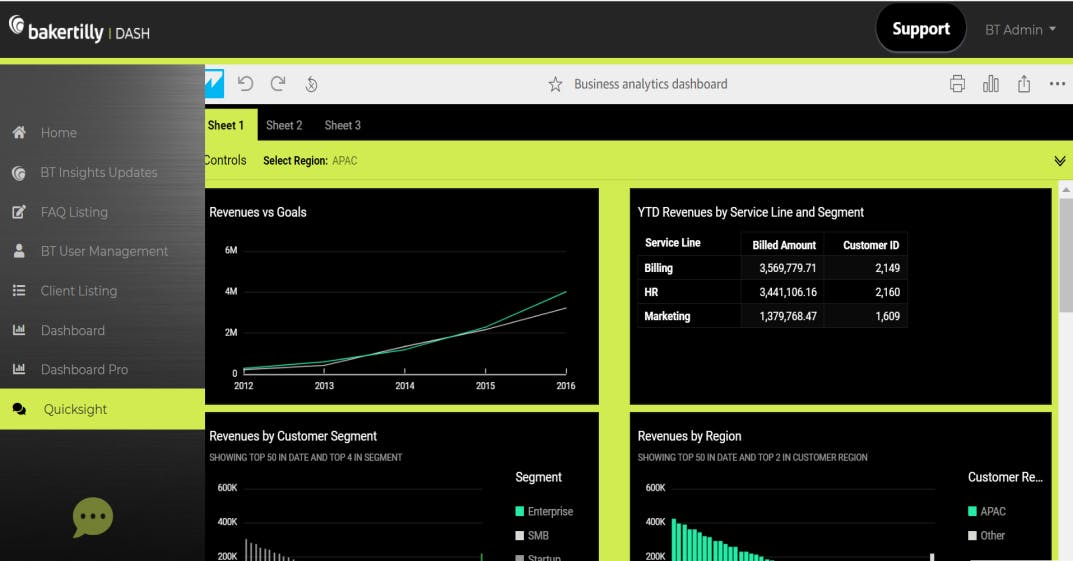
The figure below displays how the QuickSight experience can be embedded into existing applications. Users can create analysis quickly from the application itself.
Baker Tilly Digital can help
Baker Tilly Digital can help organizations fully leverage Amazon QuickSight based on their technology portfolio, product strategy, governance and operational design. Connect with our team to learn more about Amazon QuickSight and how your business can begin incorporating it into your operations.

