
Having a conversation with YOUR data
The evolution from business intelligence to analytics
Unfortunately, the struggle continues for business users. Business Intelligence (BI), perhaps better known as Decision Support, remains complicated, slow and resource intensive. However, do not blame the front-end. We will discuss traditional Data Management, the real culprit, a bit later.
What do we mean by BI? For some, BI is the data warehouse. For others, BI provides dashboards or reports. For this discussion, we define BI as the technology infrastructure used to help businesses make better decisions. In essence, BI is the plumbing that connects users to necessary data.
BI often enables the following:
- Enterprise Performance Management (EPM)
- Enterprise Data Warehousing (EDW)
- Business reporting, including dashboards, scorecards, predictive analytics and data mining
- On-Line Analytical Processing (OLAP); i.e. “cubes”
Together, these technologies enable an organization’s ability to create, maintain, analyze and report accurate information about the business. That information is used for forward-facing activities such as budgeting and forecasting.
Driving all of the above is the persisting need to analyze.
From mainframes to analytics – a quick history
Once upon a time, we ran our businesses via mainframe computers. Essentially, these machines were massive servers. Traditional data meant files, lots and lots of files, because the databases we take for granted today did not exist. These files, often referred to as data sets, had structure, were controlled by parameters, and had associated methods of access. Programmers were required to write specific, sophisticated code, using these access methods to make applications work.
During the 1970s, scientists thought through a simpler, more organized approach called the relational model. This model could be accessed via a common method called structured query language or SQL. Usage of the relational database management system (RDBMS) and SQL proliferated shortly thereafter.
Though originally meant to support transaction processes, such as those found in an Enterprise Resource Planning (ERP), the RDBMS became a sort of Swiss Army Knife for all forms of data. In addition to transaction systems, the RDBMS eventually became the standard for analytics, with the advent of the data warehouse.
This wide-spread use proved to be both useful and challenging. Useful, because of familiarity; e.g. SQL. However, since the relational model was originally optimized and intended for transaction systems, these systems stored and provided access to large quantities of details, but typically only in small doses, like to enter an order for a specific customer.
The following data flow graphic depicts the complicated and often expensive process.
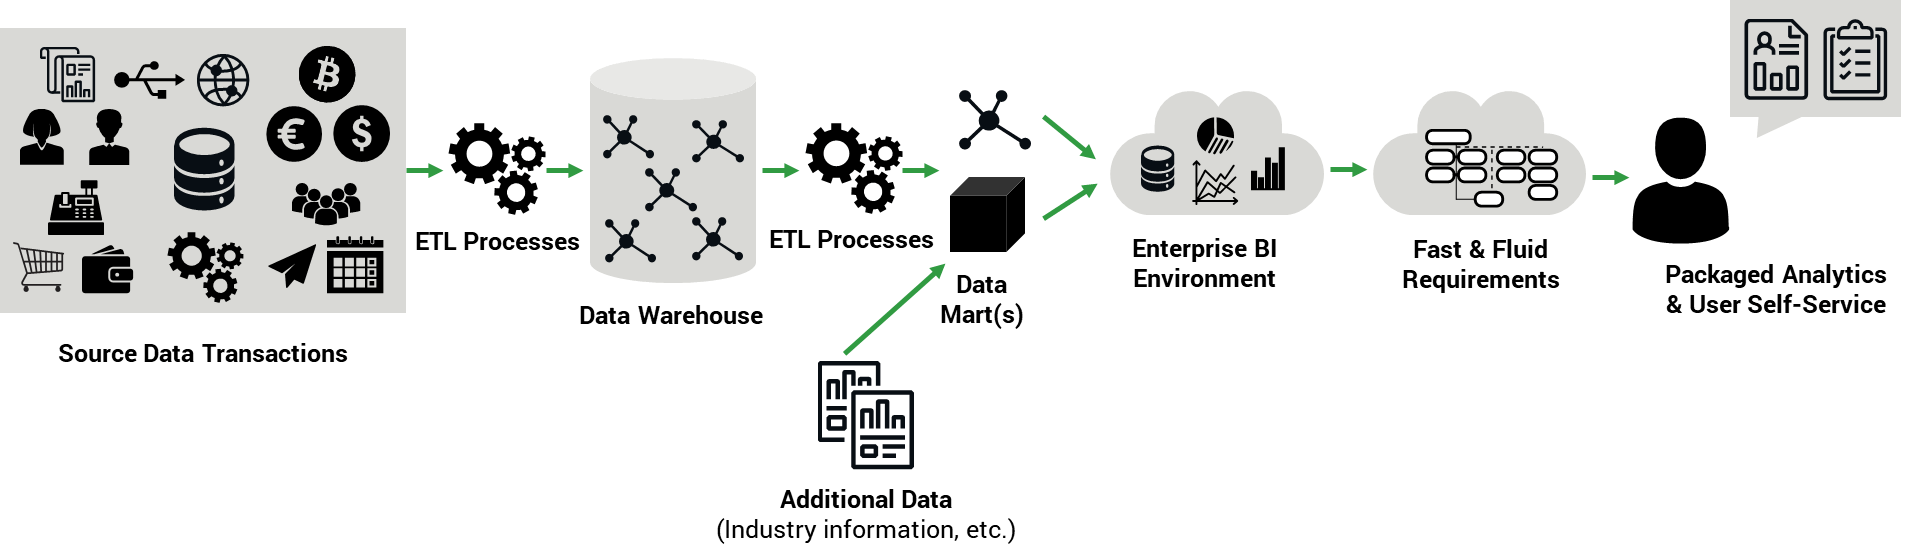
In the graphic, relational data appears throughout. The challenge, especially in today's world, are the fast and fluid requirements. The flow of data shown from “left” to “right”, requires a programmatic approach, called ETL (Extract Transform and Load). ETL development assumes highly skilled technical resources.
Analytics often requires summary information. Rather than a single customer order, one might want to see how much revenue was generated by a single customer over a period of time. This analytic need could potentially require thousands to millions of transactions be added up quickly because users do not like waiting. Unfortunately, they had to wait, from minutes to hours, since relational models were never intended to summarize transaction details so quickly. At this stage, traditional data meant relational.
The birth of cubes
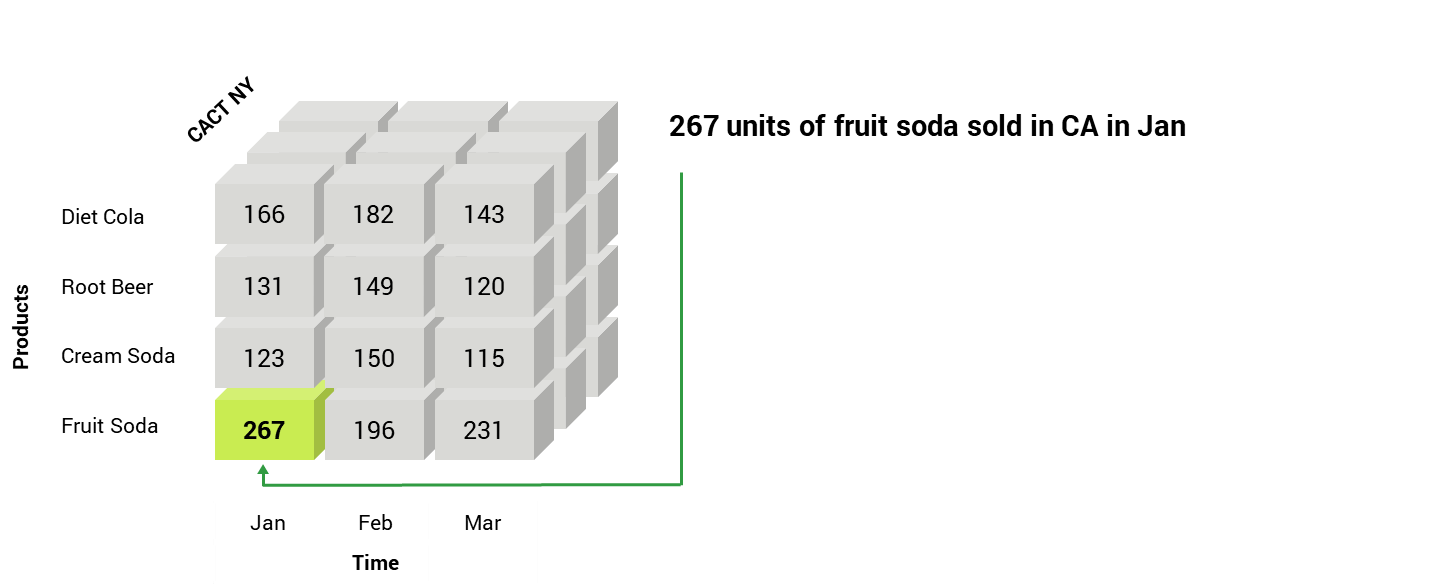
A very powerful first step in analytics came with the "cube". When E.F. Codd, the driving force behind the relational model, coined the term on-line analytical processing (OLAP) and wrote the "twelve laws of online analytical processing", many data marts transitioned from relational to multi-dimensional. In a nutshell, OLAP provides for a data structure that focused on data summarized by dimension; e.g. product, market, customer, time periods, etc. In the example at left, there were 267 units of the Fruit Soda sold in California during January.
Definitions of dimensions vary and can be very technical. Dimensions provide a way to group and navigate data, such as days to weeks to months to years. All are time. Some are detailed and some are summary.
In many ways, cubes mimic what business users create with spreadsheets - summarized data from which to make decisions.
Building cubes can be quite simple. Today's OLAP development tools are geared to business users, rather than IT professionals. That said, populating cubes can be quite challenging, necessitating the design of processes that map data from relational to the cube. ETL requires a highly skilled, programmatic approach, meaning IT involvement. The extraction or data movement happens periodically, providing the potential for a lack of synchronization.
Reports and dashboards are often … useless
Most organizations maintain myriad standard “views” of data; i.e. reports and dashboards. Unfortunately, what we want, rather, what we need, is likely strewn across several of these views. Most business users download data from reports or dashboards to Microsoft Excel or Access and create their own “version” of reality. Excel is easy and useful. Users feel in control of “their” data with Excel. However, this disconnected approach propagates bad habits – such as lack of data governance.
Business users want to have a conversation with their data.
Successful IT departments must move beyond simply providing data in a traditional manner. As BI evolves into a more proactive medium, organizations must change how users leverage and maximize data.
Enterprise BI tools provided some help, but not when it came to speed, given most sourced data from relational databases. This analytic gap spurred a greater use of personal productivity tools like Excel and Access. Users often rekeyed, copy and pasted, or imported volumes of transactions into these tools and created what they needed.
Obtaining the supporting details was problematic, as Excel can only house so many rows.
Our experience forces innovation
Innovation comes from a need to improve. Relational systems provide tremendous data depth, with questionable analytic speed. Cubes provide exceptional analytic speed with a lack of data depth. Frequently, business users require detailed insight into what actually happened as they review summary information.
The next wave of innovation promises to solve this lack of connection. It promises to enable both details and summary. That innovation has begun.
The graphic below shows a more simplified, progressive approach. The ETL processes have been eliminated. Instead of extracting subsets of data, all details come into an analytics platform, promoting ultimate visibility, from summary to transaction.
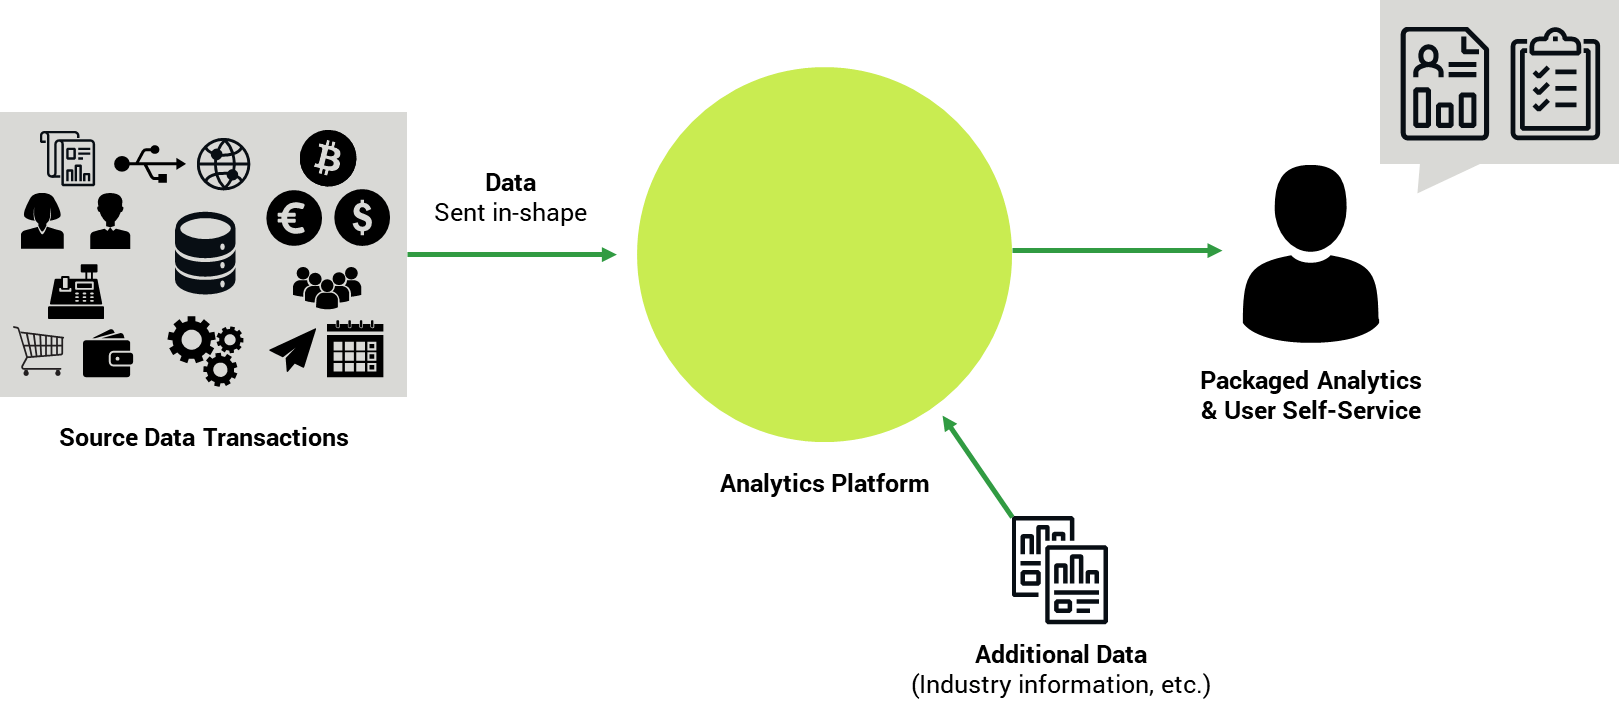
A new breed of data technology has arrived. The challenge will be to forget what we know and the comfort that comes along with it.
Conclusion
The evolution from business intelligence to a modern analytics platform is happening across every industry and within all shapes and sizes of businesses. That journey is unique for each and every one, but what is similar is that businesses are changing how data is leveraged and maximized. They are having a conversation with their data and embracing the new, mature analytics approach.
