
Assessing your excess liquidity opportunities and risks through asset liability management
The U.S. banking industry has entered 2021 with unforeseen changes to its balance sheet stemming from the COVID-19 pandemic and subsequent efforts of the government stimulus programs. Over the last 12 months, banks have experienced unprecedented deposit growth of nearly 24%, as consumers deposited federal relief payments and unemployment benefits in combination with lower spending as a result of nationwide lockdowns on traveling and social gatherings.
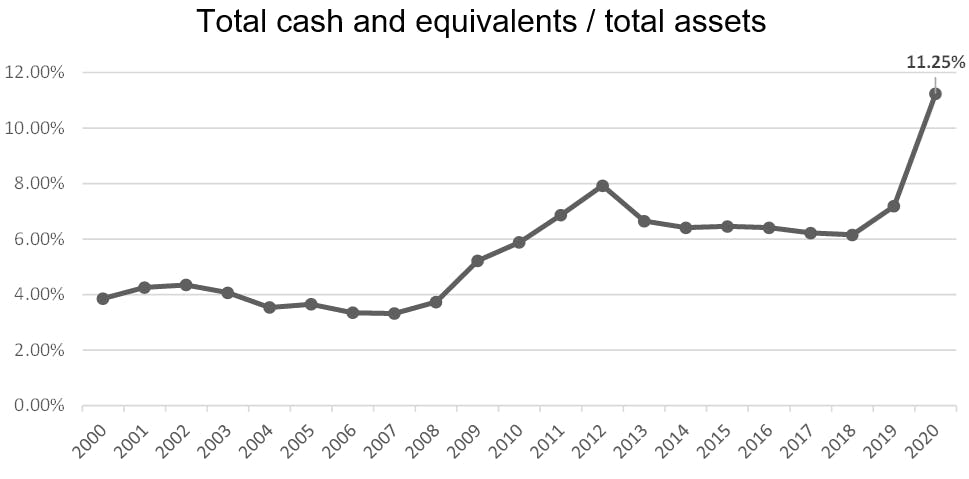
On the other side of the balance sheet, loan demand was minimal, equating to only 4% growth year over year, which includes the government’s Paycheck Protection Program loans. As a result of the difficulty for banks to utilize the deposits to fund loan originations, the median loan-to-deposit ratio has plummeted from 82% to 74% over the last 12 months, the lowest since 2013. Instead, deposits are being held in lower earning cash deposits and short-term investments. The graph below shows the large spike in the total cash and equivalents to total assets ratio since 2000. The ratio at year-end 2020 was 11.25%, up from the year-end 2019’s ratio of 7.19%, when the ratio had remained fairly stable for the last 10 years.
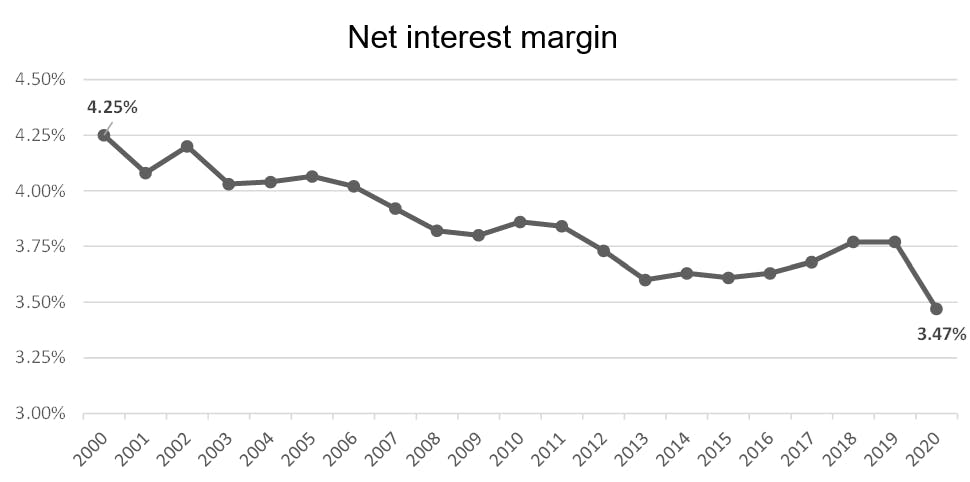
Ultimately, the shift from higher yielding loans to lower yielding cash and short-term investments has put significant pressure on net interest margins. The median net interest margin most recently declined from 3.77% as of year-end 2019, to 3.47% as of year-end 2020, the lowest recorded in over 20 years. The trend from 2000 to present is shown in the graph below.
The question remains how “sticky” these surge deposits are and when loan demand will return to a level where banks can again deploy funds into higher yielding assets. We believe banks should prepare for multiple scenarios and assess both the current opportunities to deploy the excess capital in tandem with the risks associated with holding surge deposits.
Opportunities
Your asset liability management (ALM) platform is a highly effective way to model the impacts of deploying excess funds into various loan or investment opportunities and begin analyzing the risk and return of each.
A recent Baker Tilly study asked various financial institutions if they were interested in using excess funds in forms other than its tradition lending platforms. The study found that over 75% were interested in exploring loan participations, 33% were interested in peer-to-peer lending and 25% were interested in point-of-sale merchant loans. Other methods of deploying excess capital include longer term investment purchases as well as paying down existing borrowings. Each of these strategies include varying earnings potential that need to be balanced with the impacts to the bank’s duration gap as the term of these strategies stretch to obtain higher yields.
Your ALM platform allows you to model these scenarios along with your current balance sheet and independently assess each of these key factors. The organization can then quantify the short-term and long-term effects to its balance sheet and income statement, and use those results to drive future business decisions.
Risks
On the other hand, an institution needs to also prepare for the risks associated with surge deposits. How these surge deposits will behave is a major uncertainty the banking sector is currently facing. With no clear timeline of the global pandemic and economic landscape, banks need to be prepared for multiple short-term and long-term scenarios, while estimating how deposits might behave will be key in maintaining future stability.
The first step is to dive deep into your deposit data and develop analytics to better understand exactly what your deposit portfolio consists of, the differences in customer profiles, and the surplus in each segment that poses the greatest liquidity threat to your institution. Currently, many institutions only segment the portfolio by call report or product type within their ALM model to analyze interest rate and liquidity risk. While this one method of calculating risk, we believe the analysis should be taken a step further, especially in today’s uncertain and more volatile environment.
Commercial accounts can behave much differently than retail accounts and high-net-worth individuals typically are more sensitive to changes in the environment than low-balance accounts. By incorporating these factors as well, it allows the bank to vary its assumptions applied and produce more probable indications of short-term and long-term risk.
Once the behaviors of the portfolio have been identified through in-depth analysis, the next step is to begin developing a liquidity stress testing platform to model various scenarios and determine impacts to the balance sheet. We believe the most effective way is, again, through your ALM process, as the future cash inflows and outflows of the loans, investments and maturity deposits are already being projected. Therefore, the main focus can be on the non-maturity deposit assumptions, which are the primary driver in liquidity stress-tests. Decay assumptions should be increased from base assumptions and also vary based on the factors described above (customer type, balance, etc.). Institutions should analyze deposit behaviors from previous stressed economic times as a baseline in determining these increases. Once these assumptions are stressed and the deposit outflows begin increasing, the bank can then identify when and where liquidity gaps may arise.
While many institutions will be able to cover any gaps in liquidity using primary or secondary cash sources like the Federal Home Loan Banks (FHLB) or through mortgage collateral, institutions should still be prepared. In fact, we believe modeling a worst-case or “break the bank” type scenario is fundamental in understanding at which point a liquidity crisis may occur. Once the liquidity stress test platform has been developed and tested, banks can then incorporate the analysis into their routine ALM modeling, and it can be closely monitored as we continue through these uncertain times.
Data contained in this report was gathered from S&P Global Market Intelligence, a division of S&P Global. This report includes data from over 5,000 commercial and savings banks.
